
Overview Currency Matrix Indicator For Tradestation
Of all the four principal capital markets, the world of foreign exchange trading is the most complex and most difficult to master, unless of course you have the right tools! The reason for this complexity is not hard to understand.
First, currencies are traded in pairs. Each position is a judgment of the forces driving two independent markets. If the GBP/USD for example is bullish, is this being driven by strength in the pound, or weakness in the US dollar. Imagine if we had to do the same thing trading stocks for example. Consider trading Google against Amazon. If this ‘pair’ were rising, is this being driven by strength in Google or weakness in Amazon? Almost impossible to analyse.
The Currency Market Problem
To compound this problem, every currency can be bought or sold against a myriad of other currencies. This raises the next key question. If the GBP/USD is bullish once again, is the British pound strong against all the other major currencies, such as the GBP/JPY, the GBP/CAD, the EUR/GBP etc. If so, it is clearly a sign that the UK pound is being bought across the market. Equally for the US dollar, if it is sold universally in pairs such as the USD/CAD, the USD/JPY and others, then we can assume that the GBP/USD is rising as a result of strong buying of the pound universally, and strong selling across the market of the US dollar.
Finally, we come to the third problem: assessing the strength of this buying or selling. After all a currency may be overbought (strong) or oversold (weak) but how strong is strong, and how weak is weak.
Consider this for a moment. Assume you have decided to buy the GBP/USD and have the following information to help you in your analysis:
- Whether the GBP is also being bought in all the other cross-currency pairs
- Whether the USD is also being sold in all the other major currency pairs
- The relative strength of buying in the GBP/USD pair
Trading success is all about assessing risk and the probability of success on each trade. Would this information give you a high risk, medium or low risk trading position? And the answer… is a low-risk trading opportunity. After all, you are now taking a position based on a view across the market.
First, if you are basing your decision on universal buying or selling of a currency, then you are trading with the entire weight of the market, and not just on the analysis of one currency pair – it’s low risk. Second, if you know the relative strength of this buying or selling against all the other currency pairs, then this gives you the complete picture – if its strong, then again – it’s low risk. Third and last, if you know what the counter currency is also doing in terms of strong or weak, then once more if its strong – it’s low risk.
Where The Currency Matrix Steps In
This is where the Quantum Currency Matrix steps in. It provides the solution to all three problems in one elegant indicator. It shows you the complete picture across the market in a simple matrix, which works in all timeframes from 1 minute to 1 month.
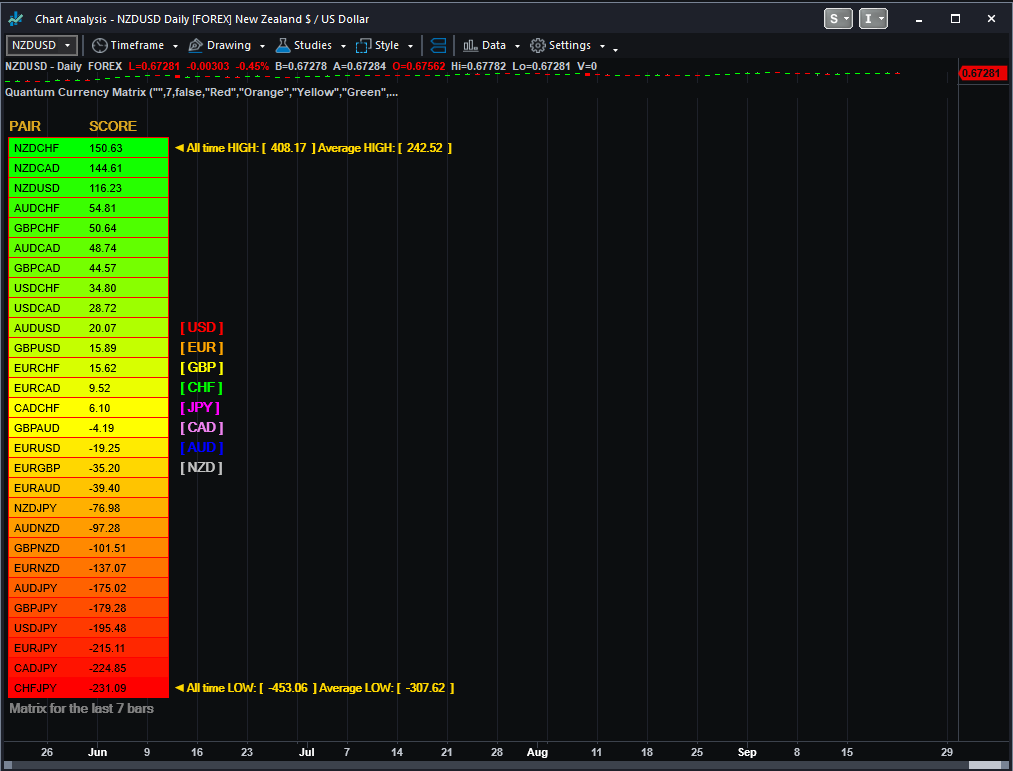
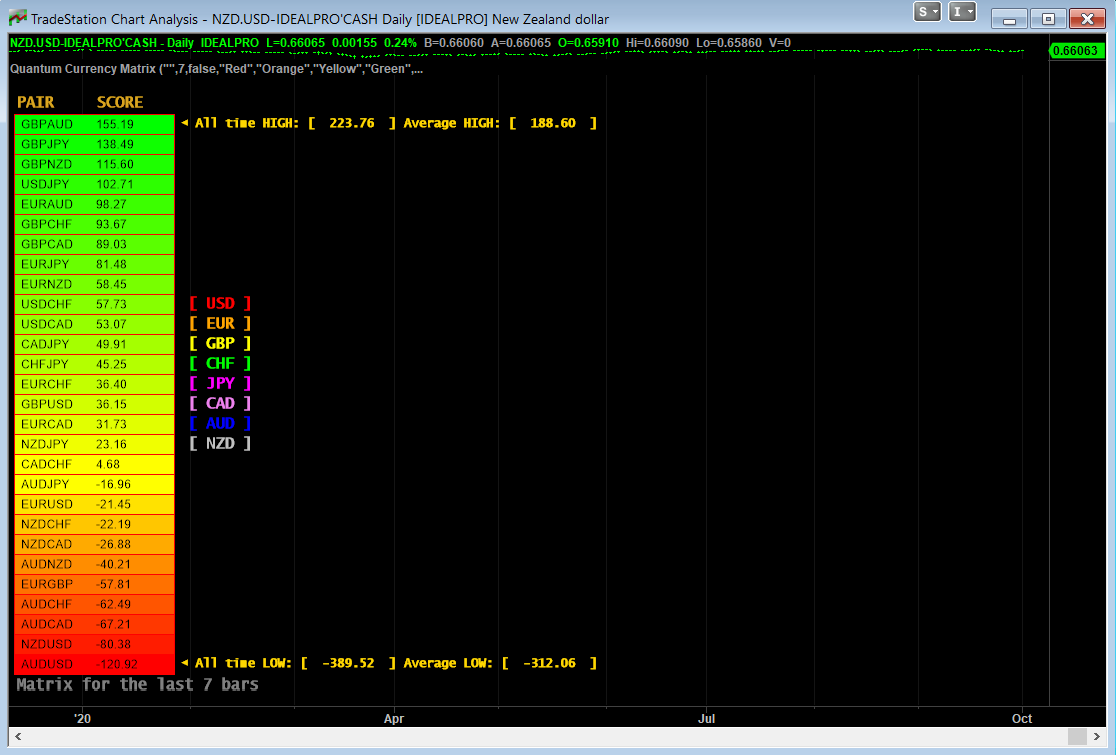
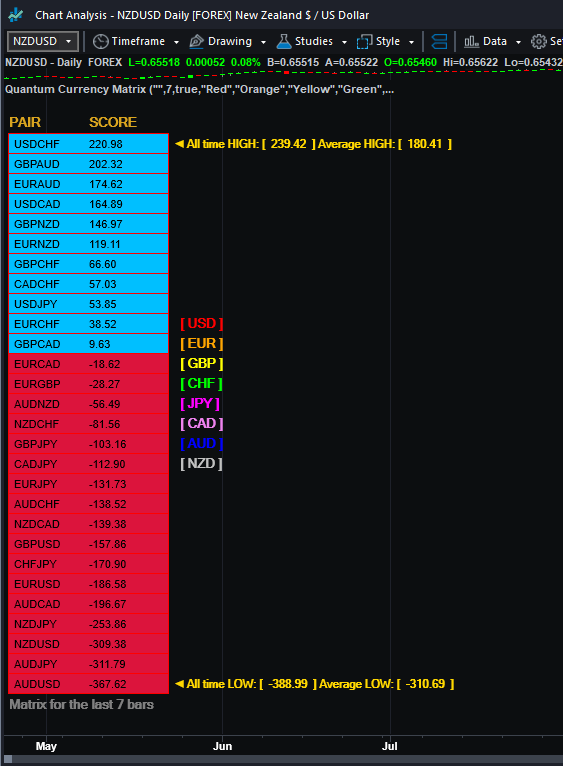
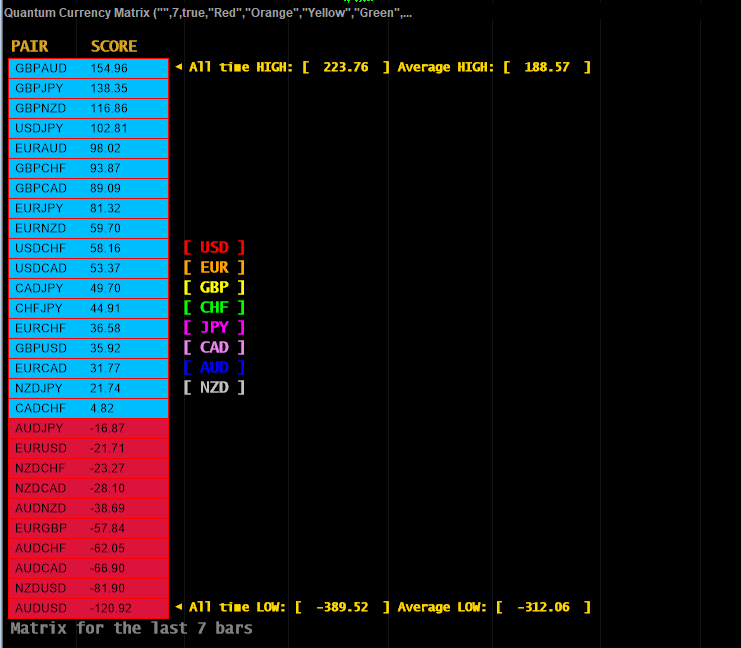
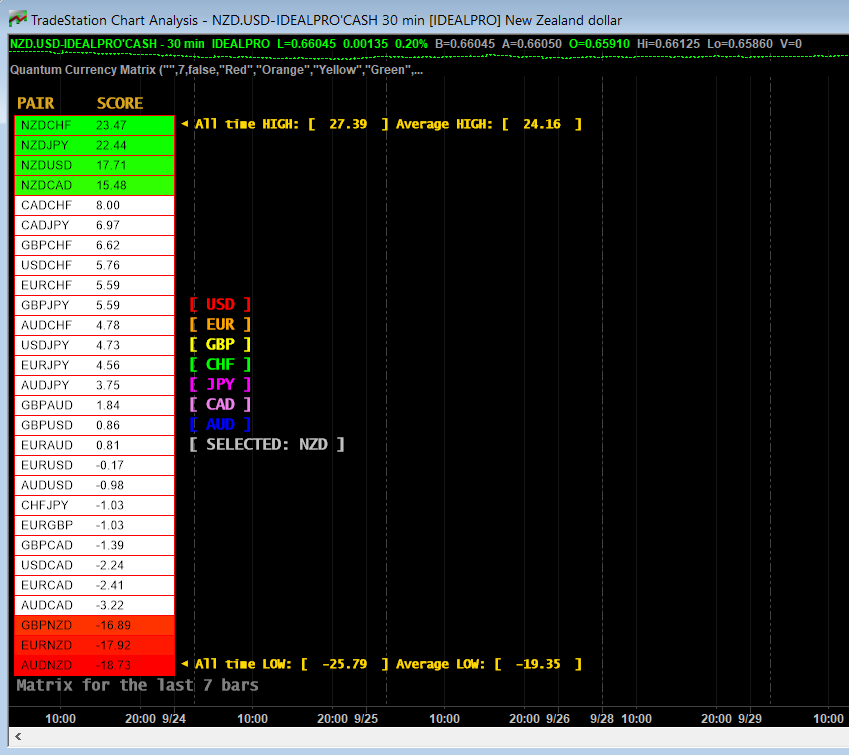
From the eight major currencies come the 28 currency pairs which are then displayed in a table, with their relative strength scores, updated second by second and minute by minute. As you can see, the Currency Matrix displays the full spectrum of currency pair strength, from very bullish at the top of the matrix (bright green) to heavily bearish at the bottom (bright red). Those currency pairs moving up or down the ladder from bullish to bearish or bearish to bullish are then shaded in the transitional colors of orange, and yellow to light green.
Every pair is displayed with a ranking score. Above 0.00 indicates the pair is moving into a bullish phase, whilst a score below 0.00 indicates bearish momentum is increasing.
Each currency can then be isolated to show the 7 associated pairs and their relative scores. If all the associated pairs are showing similar strength (either bullish or bearish) then this is either a good time to join the move, or alternatively it may be an opportunity to wait for a reversal in trend as the pair becomes overbought or oversold.
The Quantum Currency Matrix gives you the tool to see the complexities of the Forex market in real time across all the related pairs, along with the strength of the buying and selling. Whilst it is possible to do this manually using multiple charts, what a manual matrix will not provide is any measure of the relative strength. The indicator does this for you automatically by considering the price action across all the related currency pairs and then deriving the relative strength scores accordingly. These are the ranking scores which you see displayed on each currency pair and by which they are ranked in the ladder.
Currency filter
The Currency Matrix indicator allows you to filter the currency pairs relevant to the currency you are analysing. A set of buttons is provided at the right side of the table which you can click to select a currency:
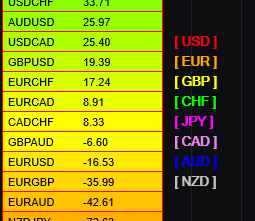
- USD is the red button which filters out and displays all currency pairs containing the US Dollar.
- EUR is the orange button which filters out and displays all the currency pairs containing the Euro.
- GBP is the yellow button which filters out and displays all the currency pairs containing the British Pound.
- CHF is the green button which filters out and displays all the currency pairs containing the Swiss Franc.
- JPY is the magenta button which filters out and displays all the currency pairs containing the Japanese Yen.
- CAD is the purple button which filters out and displays all the currency pairs containing the Canadian Dollar.
- AUD is the blue button which filters out and displays all the currency pairs containing the Australian Dollar.
- NZD is the white button which filters out and displays all the currency pairs containing the New Zealand Dollar.
The buttons work on a toggle basis. Click them once to filter, and then click again to remove the filter. When a currency filter is in effect, the relevant currency pairs in the table appear in color while the others turn white.
Extremes
“How does the strongest and weakest currency pairs in the matrix compare to the past strongest and weakest currency pairs within the period?”
This is the question that the “All time HIGH”, “Average HIGH”, “All time LOW”, and “Average LOW” numbers answer. These pieces of information are found beside the top-most and bottom-most currency pair in the matrix.
The following numbers are found at the right side of the top-most currency pair in the matrix:
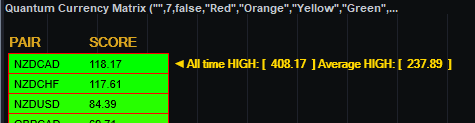
- All time HIGH – displays the highest score achieved by a currency pair within the period
- Average HIGH – displays the average highest score achieved by a currency pairs within the period
The following numbers are found at the right side of the bottom-most currency pair in the matrix:
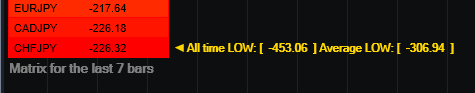
- All time LOW – displays the lowest score achieved by a currency pair within the period
- Average LOW – displays the average lowest score achieved by a currency pair within the period
Currency Dashboard
The Quantum Currency Matrix is a unique indicator. In an instant, you can see which pairs are rising strongly or falling strongly in every timeframe, and on a single chart. Whilst the Quantum Currency Strength Indicator gives you the heads up on individual currency strength and weakness, the Quantum Currency Matrix then delivers the global view for that currency in all the related pairs and for each timeframe – instantly, and giving you the tools to trade every pair with complete confidence.
- Your Quantum currency matrix indicator can be applied to any chart for any currency pair. The chart does not influence or affect the appearance or performance of the indicator. For example you can apply the indicator to a GBP/USD, a EUR/USD, or a USD/CHF, or any other pair. The indicator will display in an identical way on each chart.
- When you first apply the indicator, please allow a few seconds for the data to build in history.
By itself, the Quantum Currency Matrix indicator is a powerful trading tool for identifying trading opportunities quickly and easily. However, it was developed as part of what we like to call the Quantum Currency Dashboard which consists of the following indicators:
- Quantum Currency Strength Indicator (CSI)
- Quantum Currency Matrix
- Quantum Currency Array
- Quantum Currency Heatmap
These four indicators then provide a unique and compact insight into all the various aspects of strength and weakness for both currencies and currency pairs, from trend and momentum to overbought and oversold. What is unique is that using four charts, you are then able to monitor the myriad combinations of strength, weakness, momentum, congestion and divergence across the entire forex complex at a click of a button. And even more powerfully, giving you the confidence to get in and stay in for maximum profits. No more missed opportunities, no more struggling with multiple charts, and no more trader regret, whatever your trading style or approach.
Using the indicator in TradeStation Securities
Applying the indicator to a Chart Analysis window
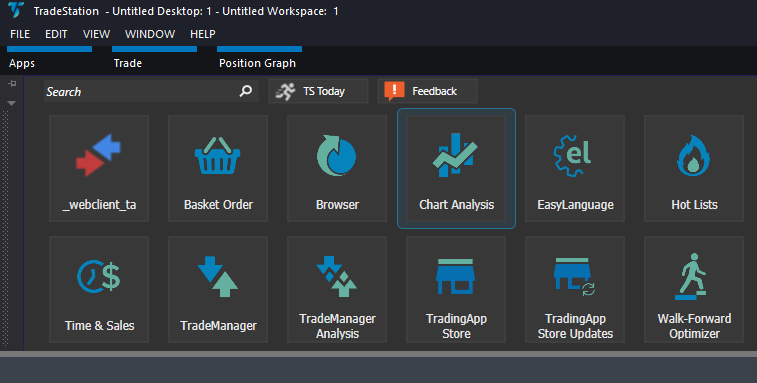
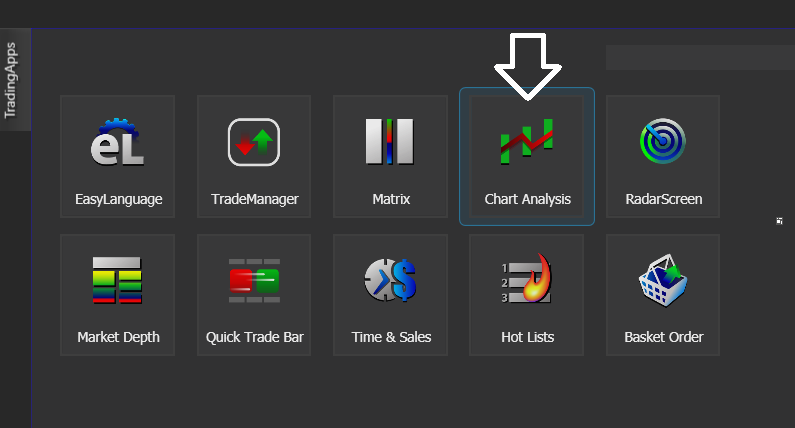
From the Apps menu of your TradeStation platform, please open a Chart Analysis window.
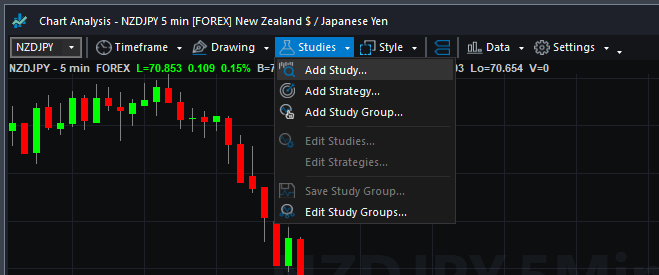
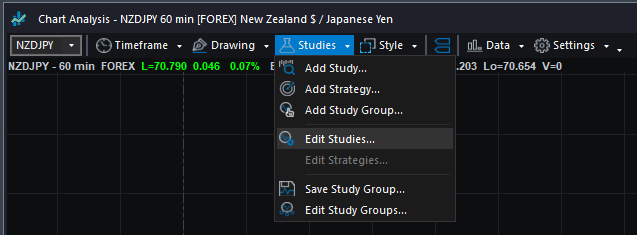
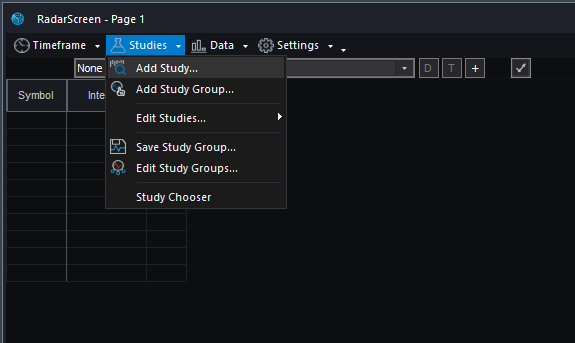
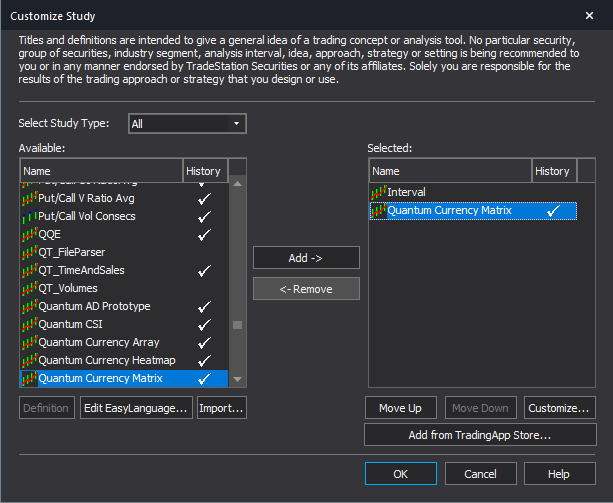
From the Chart Analysis window’s toolbar, please click Studies > Add Study…
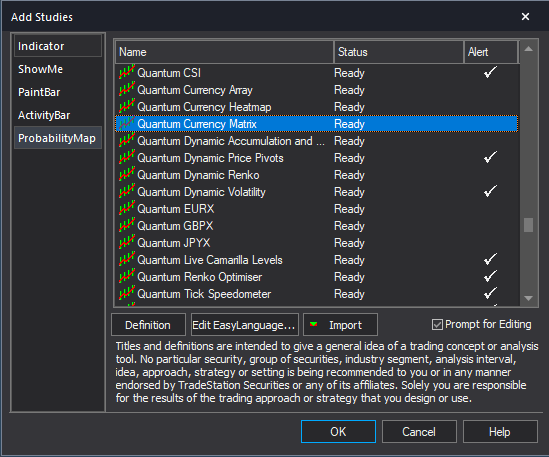
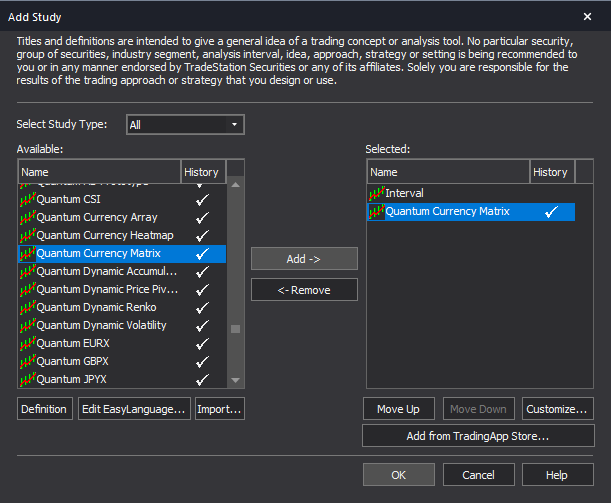
From the Add Study window, please choose Indicator at the left hand side of the interface then at the right, scroll down and select Quantum Currency Matrix. Click OK to apply the indicator to the chart.
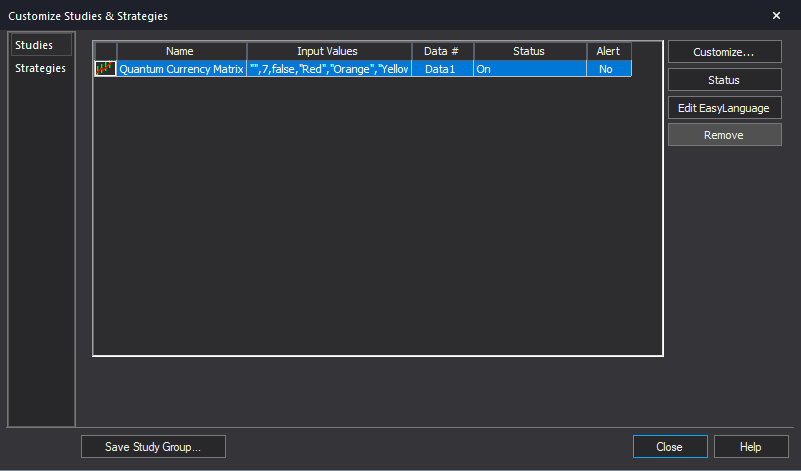
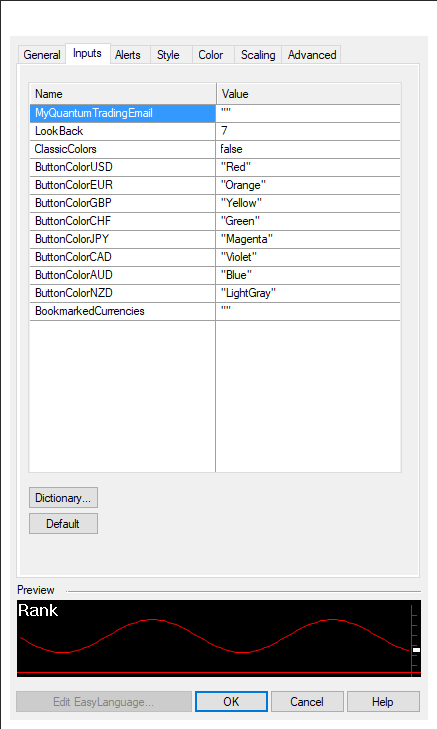
IMPORTANT: If this is your first time to run Quantum Trading indicators, the indicator will not work until you input your email address in its settings. To do this, please go back to your Chart Analysis window and click Studies > Edit Studies…
Select the indicator from the list then turn it On by clicking the Status button at the right hand side of the window. Click Customize… or double-click the Quantum Currency Matrix to open the Customize Indicator window. In the Inputs section, find the MyQuantumTradingEmail input and enter here the email address you used at the Quantum Trading Shop to activate the indicator. PLEASE MAKE SURE TO ENCLOSE THE EMAIL ADDRESS IN DOUBLE QUOTATION MARKS. (example: “myemailaddress@gmail.com”)
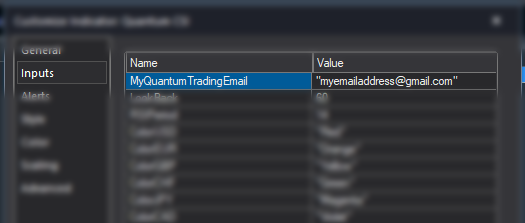
Click OK (and Close) to save and go back to your chart. Please note that you need to do this only once which means you do not need to input your email address again when running Quantum Trading indicators next time.
Customizing the indicator in Chart Analysis
Inputs
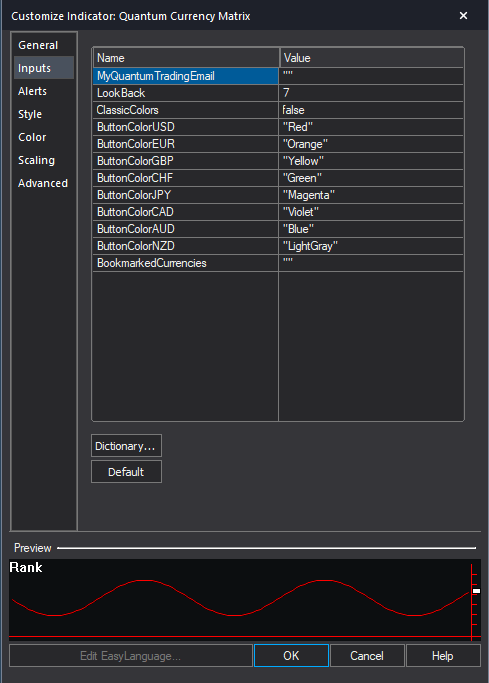
- MyQuantumTradingEmail – When running the indicator for the first time in your TradeStation trading account, you need to enter the email address you used to purchase the indicator in the Quantum Trading Shop as part of its verification process. You need to do this only once as the indicators “remember” your email address by storing it in the local drive. Please make sure that you enter your email address correctly and exactly without any extra spaces before and after it. If you made an error, simply fill this input again to update it. This is a string input which requires you to enclose your email address in double quotation marks (“”).
- LookBack – The Currency Matrix requires a significant amount of processing power compared to most indicators and this input limits it to calculate the last 7 bars by default. The higher the value of this input is, the more processing power is required, although you can change this if you wish to extend its coverage in the bar history. It also helps in keeping the indicator’s output relevant according to the most current price action.
- ClassicColors – Instead of using a Green-Red gradient, the indicator switches to a dual color scheme when this setting is true. When using classic colors, all currency pairs with a score above 0 are blue and those below 0 are red. This is set to false by default.
- ButtonColorUSD, ButtonColorEUR, ButtonColorGBP, ButtonColorCHF, ButtonColorJPY, ButtonColorCAD, ButtonColorAUD, ButtonColorNZD – These inputs define the colors of the indicator’s currency buttons. They are string inputs which means you need to enclose the name color in double quotation marks (“”). Named colors are the only accepted values in these inputs which are all listed in the following link – http://help.tradestation.com/09_01/tsdevhelp/Subsystems/elobject/class_win/color_class.htm
The color of a line reverts to the default named color if the input’s value is invalid. - BookmarkedCurrencyPairs– This input helps you keep track of currency pairs you’re interested in wherever they are in the list. To bookmark a currency pair, simply enter its symbol (without any prefix or suffix) in this field like so:
“eurusd”
You can bookmark multiple currency pairs at the same time by adding a space between them. For example, if you like to bookmark EURUSD, AUDCHF and USDJPY, simply enter the following value in this field:
“eurusd audchf usdjpy”
All bookmarked currency pairs are given a different color so you can see them easily in the constantly changing list. They are also not affected by the currency filters. This is a string input which means you need to enclose the currency pair(s) in double quotation marks (“”).
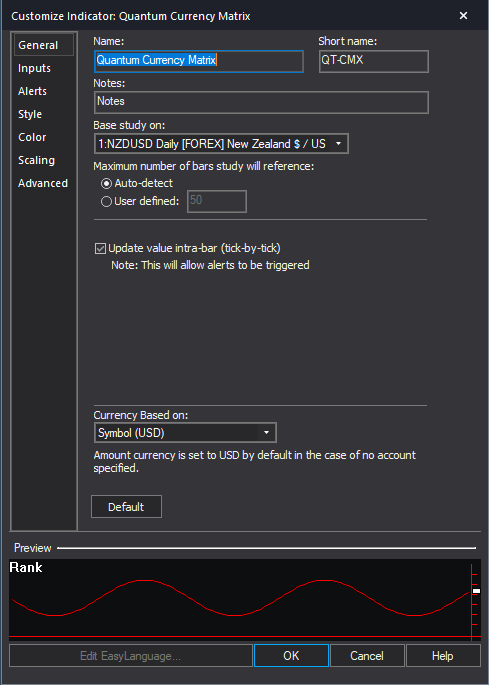
General
You can modify the name, short name, notes, maximum number of bars the indicator will reference, and more. We do not recommend changing any of the settings in this section but you can learn more about the different options in the General tab in TradeStation’s help guide at the link below.
http://help.tradestation.com/10_00/eng/tradestationhelp/study/customize_study_general.htm
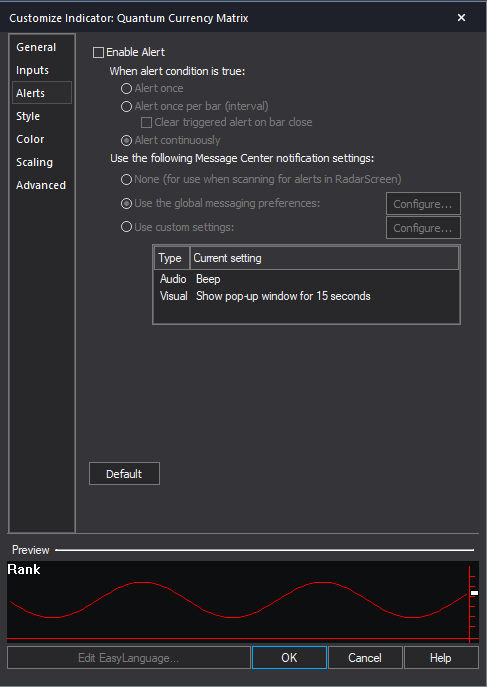
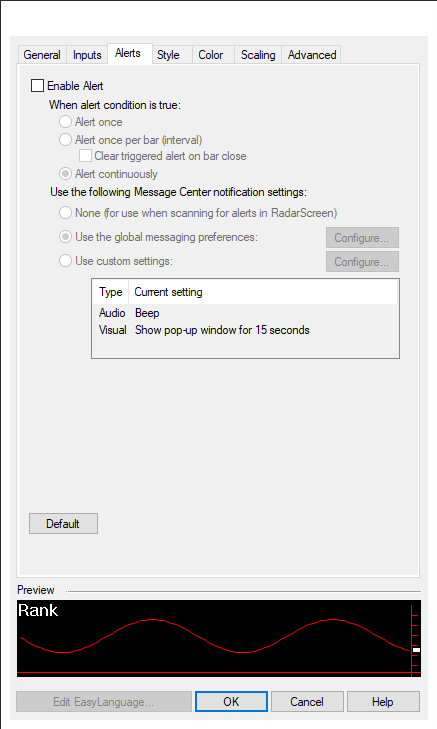
Alerts
The Currency Matrix does not have built-in alert functions.
You can learn more about the different options in the Alerts tab in TradeStation’s help guide at the link below.
http://help.tradestation.com/10_00/eng/tradestationhelp/study/customize_study_alerts.htm
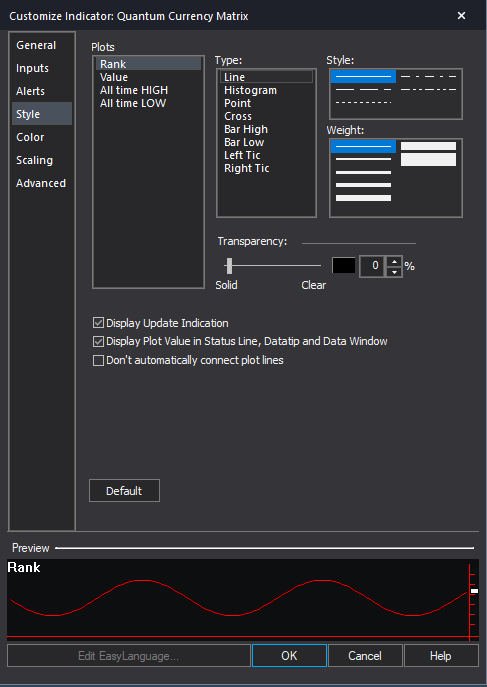
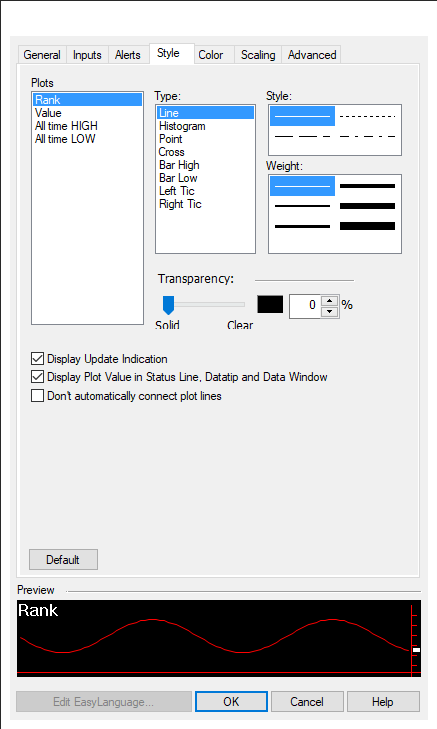
Style
We do not recommend changing the settings in this section as the Currency Matrix does not plot lines.
You can learn more about the different options in the Style tab in TradeStation’s help guide at the link below.
http://help.tradestation.com/10_00/eng/tradestationhelp/study/customize_study_style.htm
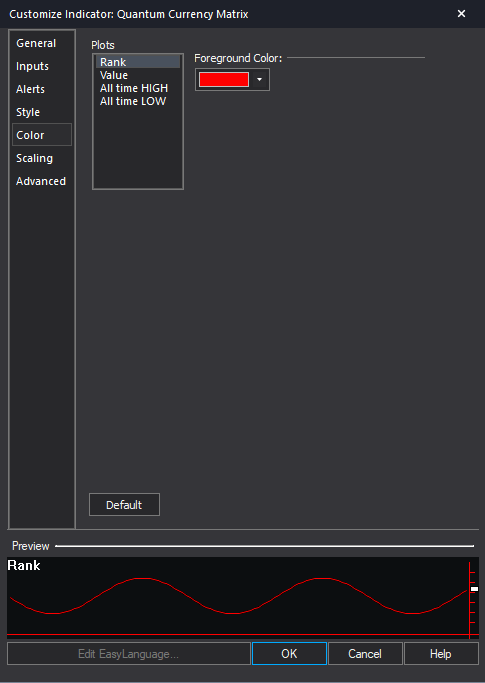
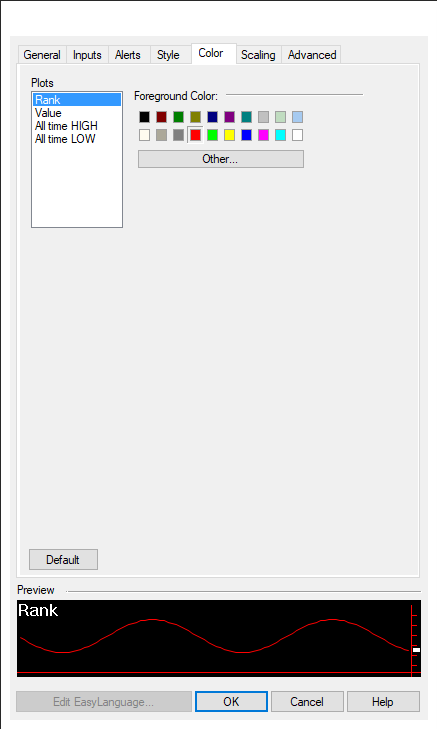
Color
We do not recommend changing the colors of the indicator in this section. Instead, please use the “ButtonColor…” inputs defined in its Inputs to safely change the color of the currency buttons.
You can learn more about the different options in the Color tab in TradeStation’s help guide at the link below.
http://help.tradestation.com/10_00/eng/tradestationhelp/study/customize_study_color.htm
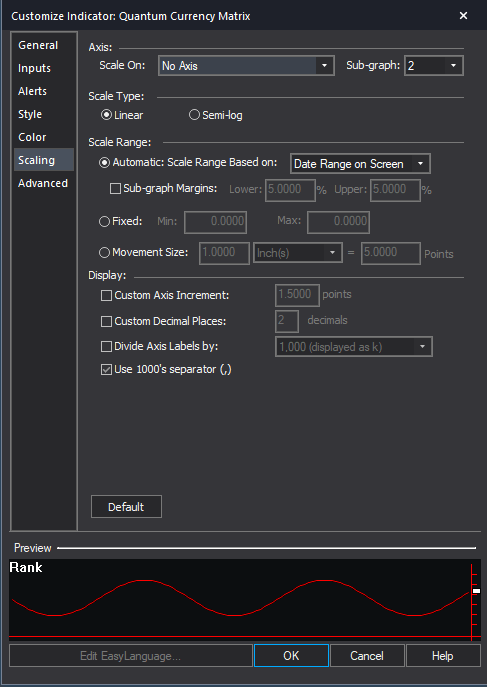
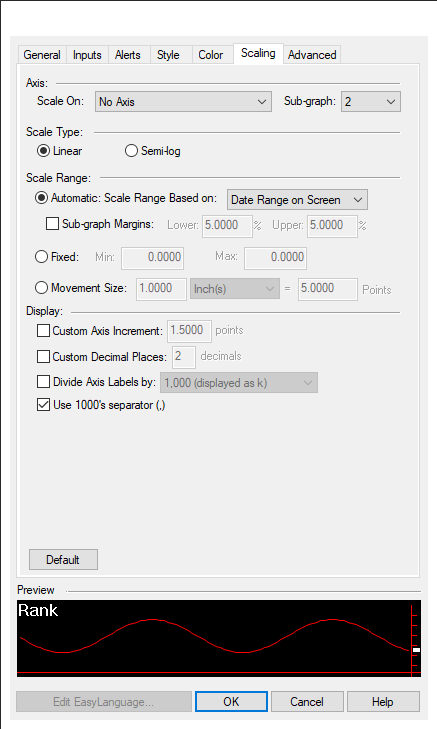
Scaling
The Scaling tab is used to modify the scaling settings for the y-axis of the indicator in the active Chart Analysis window. We do not recommend changing any of the settings in this section but you can learn more about the different options in the Scaling tab in TradeStation’s help guide at the link below.
http://help.tradestation.com/10_00/eng/tradestationhelp/study/customize_study_scaling.htm
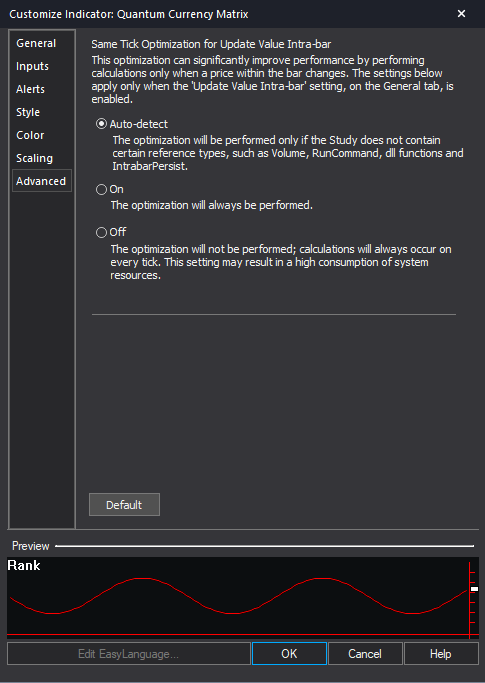
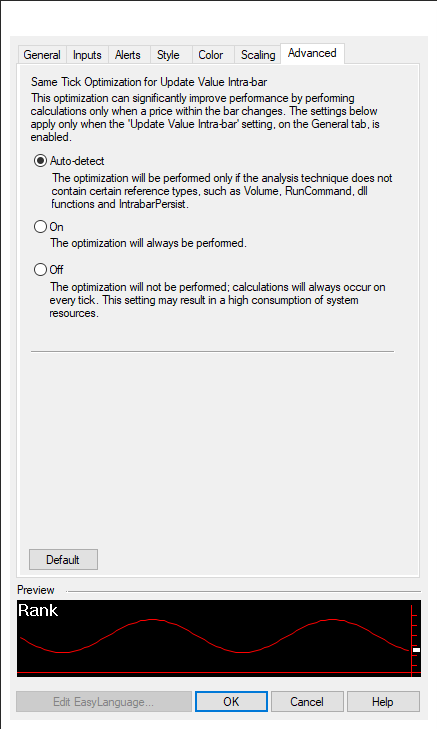
Advanced
The Advanced tab allows you to set advanced preferences for the indicator. We do not recommend changing any of the settings in this section but you can learn more about the different options in the Advanced tab in TradeStation’s help guide at the link below.
http://help.tradestation.com/10_00/eng/tradestationhelp/study/customize_study_advanced.htm
Making adjustments to the user interface in Chart Analysis
Currency Buttons
The currency buttons are the colored text enclosed in square brackets located at the right side of the matrix. Please note that you need to extend the border of the indicator vertically to reveal the currency buttons. Please see the section below for more details.
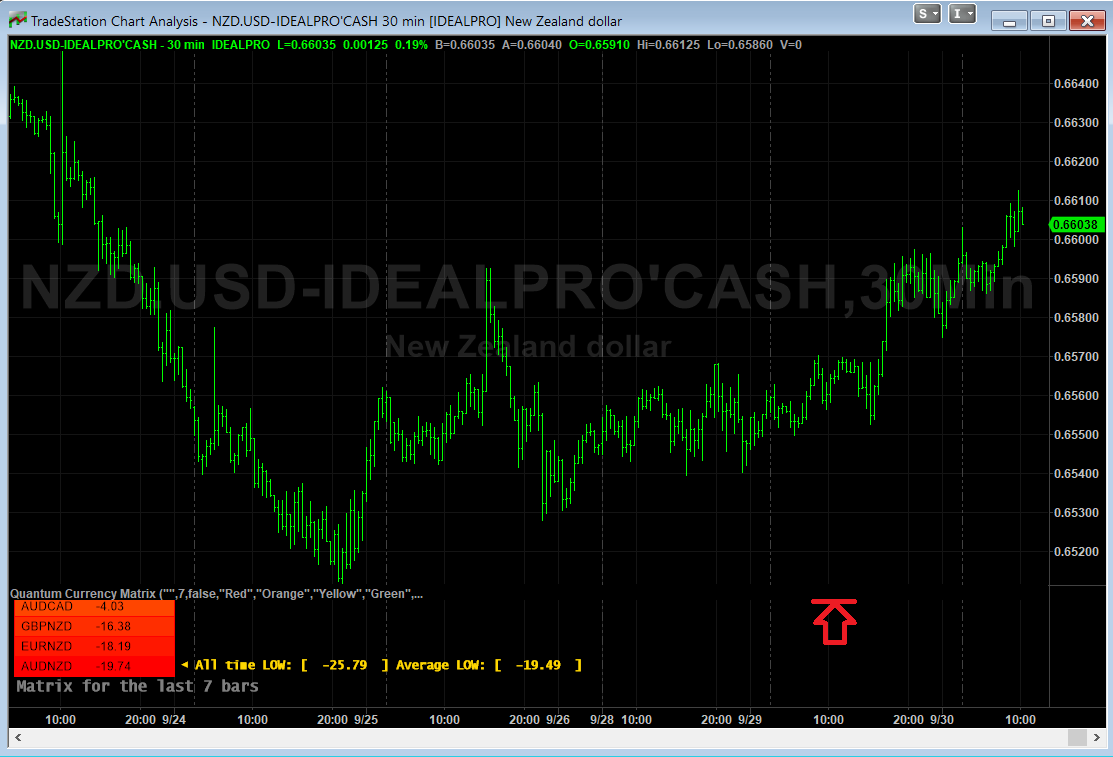
Each button represents one of the 8 major currency pairs: USD, EUR, GBP, CHF, JPY, CAD, AUD and NZD. Clicking a button toggles the color of the currency pairs in the matrix that contain the currency. A button can be one of 2 states: NOT SELECTED or SELECTED. Clicking a button selects it and displays the word “SELECTED” in the button label. Clicking the button again, deselects the button and returns to its normal state.
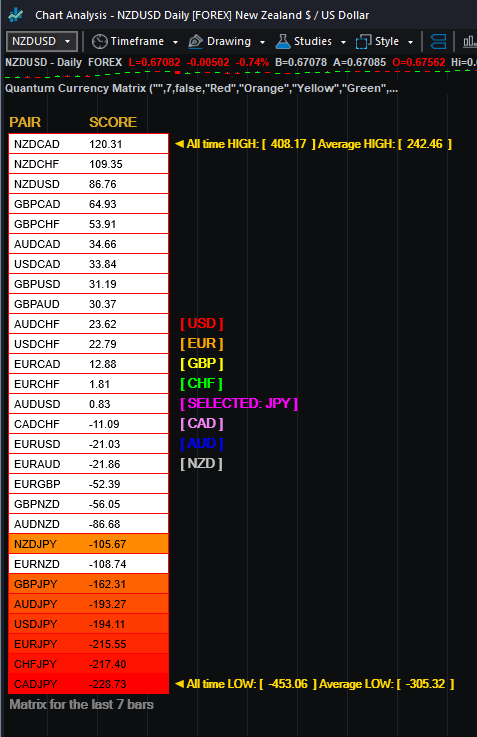
For example: [ JPY ] is not selected while [ SELECTED: JPY ] is selected.
- When a button is selected, all currency pairs in the matrix that contain the selected currency retain their color while the others turn white.
- Selecting another button deselects the previously selected button as only one currency can be selected at any moment.
- Clicking a selected button deselects it and returns the matrix to its normal state.
Using the currency buttons, you can easily focus on a currency or group of currencies easily.
Expanding the Indicator’s Screen Size
Follow the steps below to expand the Quantum Currency Matrix’s screen size in the chart.
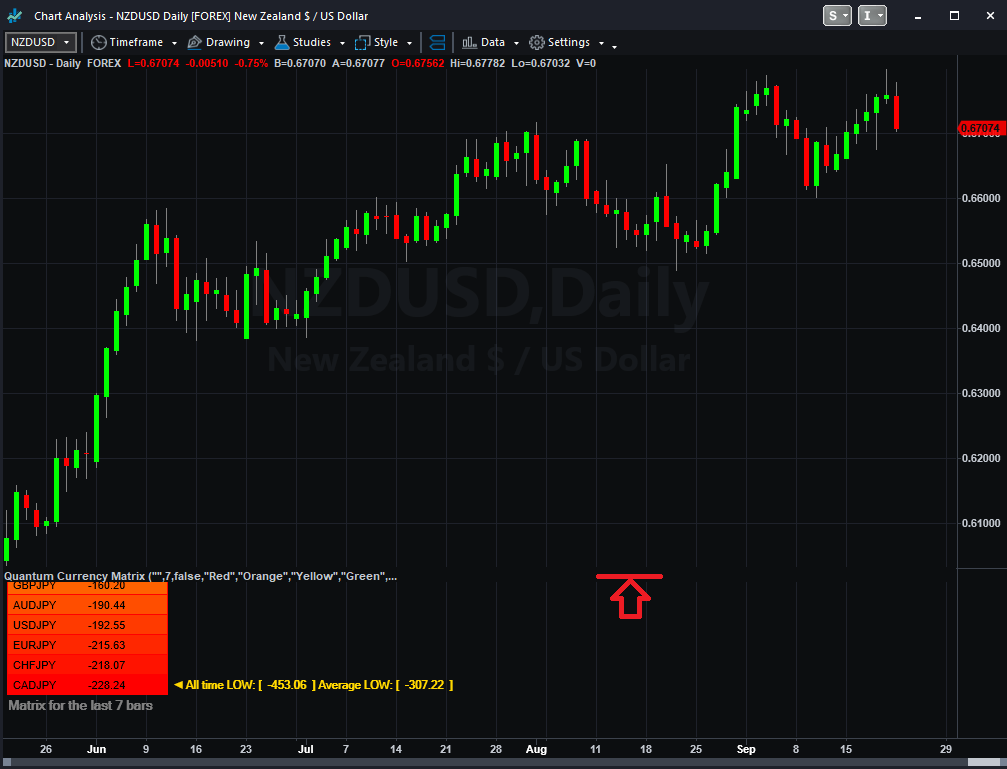
- Hover your mouse pointer over the space between the Quantum Currency Matrix and the chart above it until the mouse cursor changes into a double headed arrow
- HOLD down the left click on your mouse, and drag the mouse to the top until the entire indicator is visible
- Hover your mouse over the right hand edge of the chart until a double headed arrow appears
- HOLD down the left click on your mouse, and drag the right hand edge of the chart across to the left and release when done
- Click on the chart to make it the active window
- Click on the Increase Spacing – Up Arrow icon below, to expand your indicator to full size. The Increase Spacing – Up Arrow button is shown below when you hover over the bottom portion of the chart window.
Removing the indicator from the Chart Analysis window
From the Chart Analysis window’s toolbar, please click Studies > Edit Studies…
In the Studies tab, select Quantum Currency Matrix and click Remove then click Close.
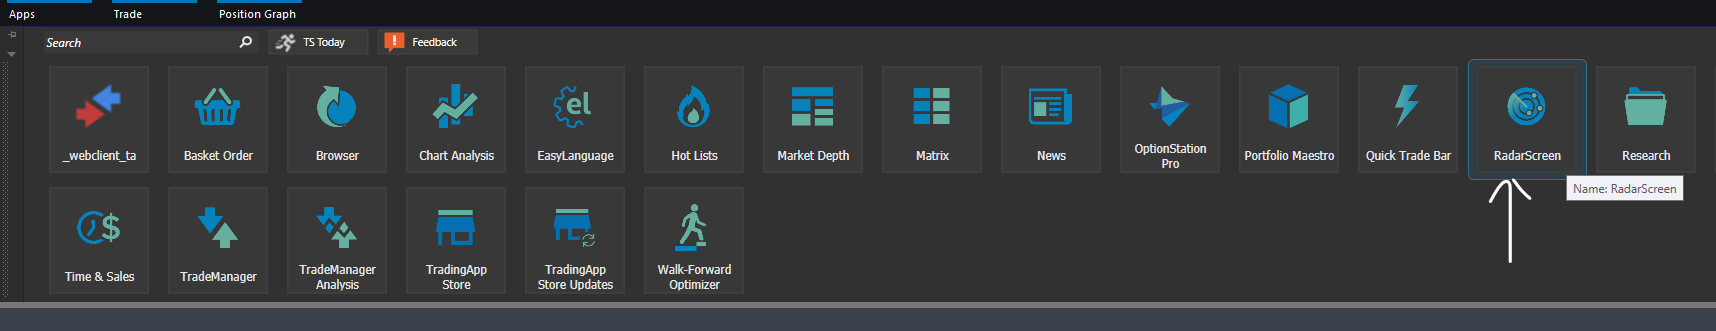
Applying the indicator to RadarScreen
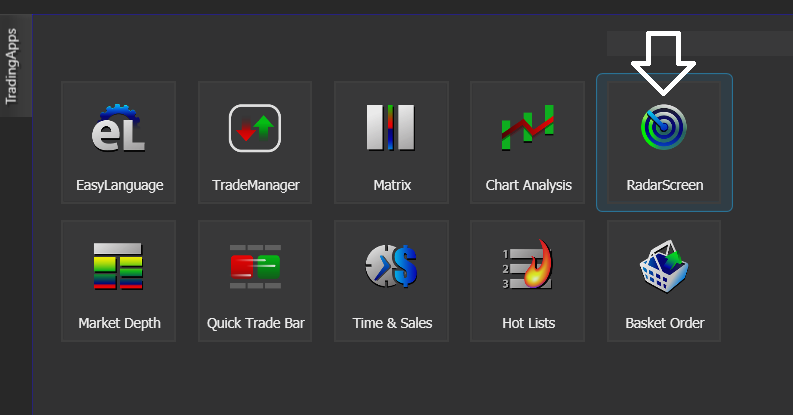
From the Apps menu of your TradeStation platform, please open a RadarScreen window.
From the RadarScreen window’s toolbar, please click Studies > Add Study…
From the Add Study window, please choose Indicator at the left hand side of the interface then at the right, scroll down and select Quantum Currency Matrix. Click OK to apply the indicator to the chart.
IMPORTANT: If this is your first time to run Quantum Trading indicators, the indicator will not work until you input your email address in its settings. To do this, please go back to your RadarScreen window and click Studies > Edit Studies… > All Studies…
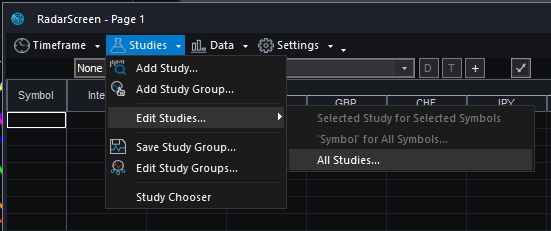
Double-click the Quantum Currency Matrix to open the Customize Indicator window. In the Inputs section, find the MyQuantumTradingEmail input and enter here the email address you used at the Quantum Trading Shop to activate the indicator. PLEASE MAKE SURE TO ENCLOSE THE EMAIL ADDRESS IN DOUBLE QUOTATION MARKS. (example: “myemailaddress@gmail.com”)
Click OK (and Close) to save and go back to RadarScreen. Please note that you need to do this only once which means you do not need to input your email address again when running Quantum Trading indicators next time.
Compatible symbols in RadarScreen
The indicator works with currency pairs that belong to the combination of the 8 major currencies which are USD, EUR, GBP, CHF, JPY, CAD, AUD and NZD.
RadarScreen columns
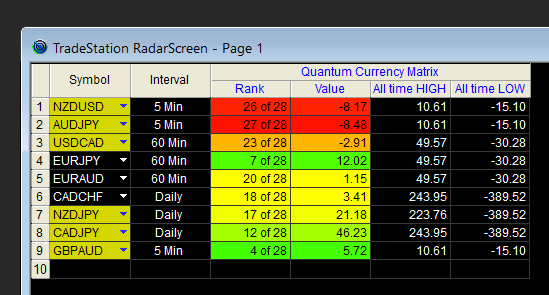
Rank
Displays the rank (top to bottom from bullish to bearish) of the currency pair out of the 28 currency pairs in the row’s Interval (timeframe)
Value
Displays the performance score of the currency pair in the current interval (timeframe) within the LookBack period
All time HIGH
Displays the highest score achieved by a currency pair within the LookBack period
All time LOW
Displays the lowest score achieved by a currency pair within the LookBack period
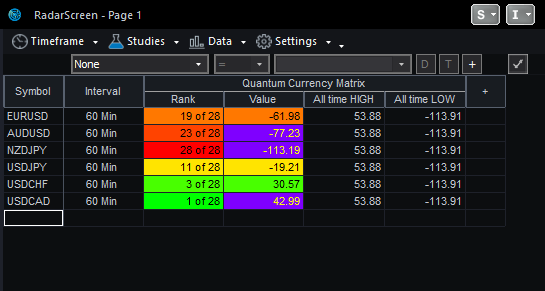
Color changes in the RadarScreen
The cell’s background and text color may change on certain conditions.
Cell background color changes
- Green shades (Rank & Value columns) – the currency pair is at the top part of the matrix (bullish)
- Yellow shades (Rank & Value columns) the currency pair is at the middle part of the matrix
- Red shades (Rank & Value columns) – the currency pair is at the bottom part of the matrix (bearish)
- Violet (Value column) – the currency pair is either notably strong or notably weak
Removing the indicator from RadarScreen
From the RadarScreen window’s toolbar, please click Studies > Edit Study… > All Studies… then select/click Quantum Currency Matrix in the list at right hand side of the window. Click the “<- Remove” button then click OK to close the window.
Using the indicator in TradeStation Global
Applying the indicator to a Chart Analysis window
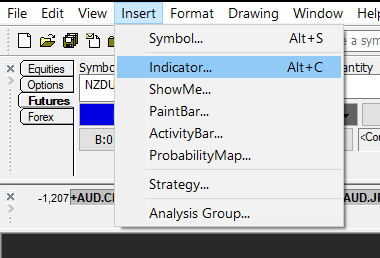
From the Apps menu of your TradeStation platform, please open a Chart Analysis window.
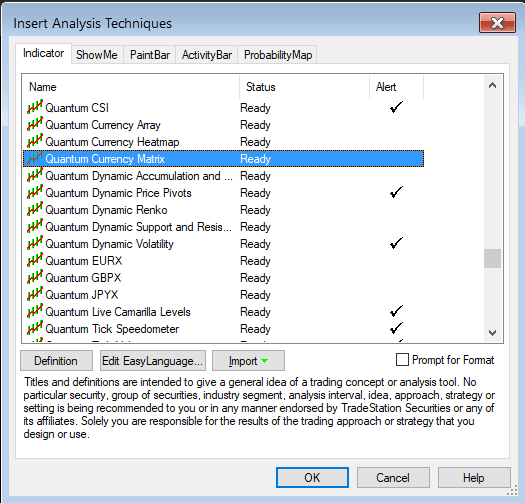
From the menu bar, click Insert > Indicator… > Indicator tab then scroll down at the list and select the Quantum Currency Matrix and click OK to apply the indicator in the chart.
IMPORTANT: If this is your first time to run Quantum Trading indicators, the indicator will not work until you input your email address in its settings. To do this, please go back to your Chart Analysis window then in the menu bar, click Format > Analysis Techniques…
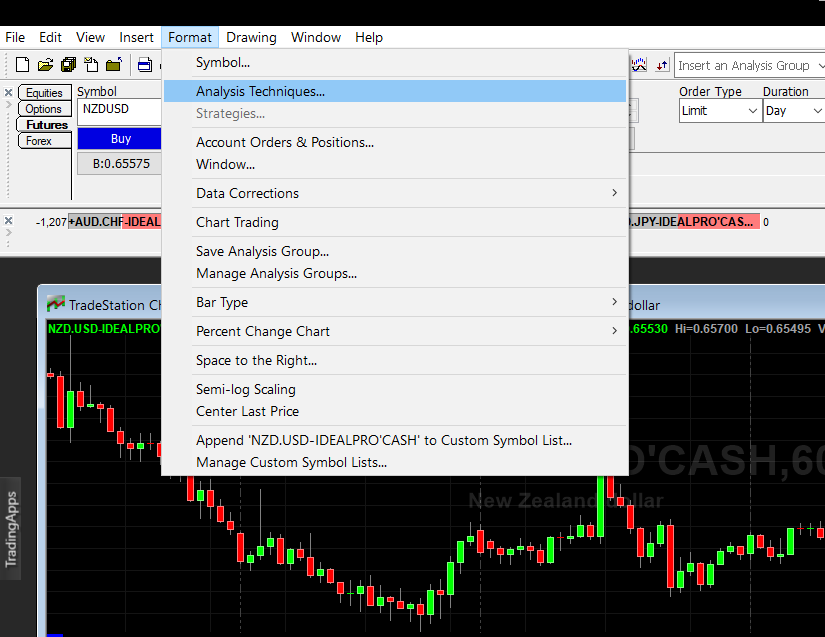
Select the indicator from the list then turn it On by clicking the Status button at the right hand side of the window. Click Format… or double-click the Quantum Currency Matrix to open the Format Indicator window. In the Inputs section, find the MyQuantumTradingEmail input and enter here the email address you used at the Quantum Trading Shop to activate the indicator. PLEASE MAKE SURE TO ENCLOSE THE EMAIL ADDRESS IN DOUBLE QUOTATION MARKS. (example: “myemailaddress@gmail.com”)
Click OK (and Close) to save and go back to your chart. Please note that you need to do this only once which means you do not need to input your email address again when running Quantum Trading indicators next time.
Customizing the indicator in Chart Analysis
Inputs
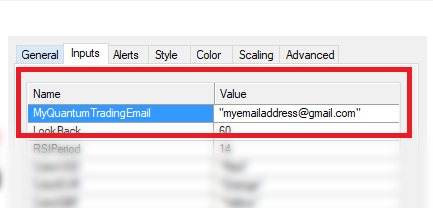
- MyQuantumTradingEmail – When running the indicator for the first time in your TradeStation trading account, you need to enter the email address you used to purchase the indicator in the Quantum Trading Shop as part of its verification process. You need to do this only once as the indicators “remember” your email address by storing it in the local drive. Please make sure that you enter your email address correctly and exactly without any extra spaces before and after it. If you made an error, simply fill this input again to update it. This is a string input which requires you to enclose your email address in double quotation marks (“”).
- LookBack – The Currency Matrix requires a significant amount of processing power compared to most indicators and this input limits it to calculate the last 7 bars by default. The higher the value of this input is, the more processing power is required, although you can change this if you wish to extend its coverage in the bar history. It also helps in keeping the indicator’s output relevant according to the most current price action.
- ClassicColors – Instead of using a Green-Red gradient, the indicator switches to a dual color scheme when this setting is true. When using classic colors, all currency pairs with a score above 0 are blue and those below 0 are red. This is set to false by default.
- ButtonColorUSD, ButtonColorEUR, ButtonColorGBP, ButtonColorCHF, ButtonColorJPY, ButtonColorCAD, ButtonColorAUD, ButtonColorNZD – These inputs define the colors of the indicator’s currency buttons. They are string inputs which means you need to enclose the name color in double quotation marks (“”). Named colors are the only accepted values in these inputs which are all listed in the following link – http://help.tradestation.com/09_01/tsdevhelp/Subsystems/elobject/class_win/color_class.htm
The color of a line reverts to the default named color if the input’s value is invalid. - BookmarkedCurrencyPairs– This input helps you keep track of currency pairs you’re interested in wherever they are in the list. To bookmark a currency pair, simply enter its symbol (without any prefix or suffix) in this field like so:
“eurusd”
You can bookmark multiple currency pairs at the same time by adding a space between them. For example, if you like to bookmark EURUSD, AUDCHF and USDJPY, simply enter the following value in this field:
“eurusd audchf usdjpy”
All bookmarked currency pairs are given a different color so you can see them easily in the constantly changing list. They are also not affected by the currency filters. This is a string input which means you need to enclose the currency pair(s) in double quotation marks (“”).
General
You can modify the name, short name, notes, maximum number of bars the indicator will reference, and more. We do not recommend changing any of the settings in this section but you can learn more about the different options in the General tab in TradeStation’s help guide at the link below.
Alerts
The Currency Matrix does not have built-in alert functions.
You can learn more about the different options in the Alerts tab in TradeStation’s help guide at the link below.
Style
We do not recommend changing the settings in this section as the Currency Matrix does not plot lines.
You can learn more about the different options in the Style tab in TradeStation’s help guide at the link below.
Color
We do not recommend changing the colors of the indicator in this section. Instead, please use the “ButtonColor…” inputs defined in its Inputs to safely change the color of the currency buttons.
You can learn more about the different options in the Color tab in TradeStation’s help guide at the link below.
Scaling
The Scaling tab is used to modify the scaling settings for the y-axis of the indicator in the active Chart Analysis window. We do not recommend changing any of the settings in this section but you can learn more about the different options in the Scaling tab in TradeStation’s help guide at the link below.
Advanced
The Advanced tab allows you to set advanced preferences for the indicator. We do not recommend changing any of the settings in this section but you can learn more about the different options in the Advanced tab in TradeStation’s help guide at the link below.
Making adjustments to the user interface in Chart Analysis
Currency Buttons
The currency buttons are the colored text enclosed in square brackets located at the right side of the matrix. Please note that you need to extend the border of the indicator vertically to reveal the currency buttons. Please see the section below for more details.
Each button represents one of the 8 major currency pairs: USD, EUR, GBP, CHF, JPY, CAD, AUD and NZD. Clicking a button toggles the color of the currency pairs in the matrix that contain the currency. A button can be one of 2 states: NOT SELECTED or SELECTED. Clicking a button selects it and displays the word “SELECTED” in the button label. Clicking the button again, deselects the button and returns to its normal state.
For example: [ NZD ] is not selected while [ SELECTED: NZD ] is selected.
- When a button is selected, all currency pairs in the matrix that contain the selected currency retain their color while the others turn white.
- Selecting another button deselects the previously selected button as only one currency can be selected at any moment.
- Clicking a selected button deselects it and returns the matrix to its normal state.
Using the currency buttons, you can easily focus on a currency or group of currencies easily.
Expanding the Indicator’s Screen Size
Follow the steps below to expand the Quantum Currency Matrix’s screen size in the chart.
- Hover your mouse pointer over the space between the Quantum Currency Matrix and the chart above it until the mouse cursor changes into a double headed arrow
- HOLD down the left click on your mouse, and drag the mouse to the top until the entire indicator is visible
- Hover your mouse over the right hand edge of the chart until a double headed arrow appears
- HOLD down the left click on your mouse, and drag the right hand edge of the chart across to the left and release when done
- Click on the chart to make it the active window
- Click on the Increase Spacing – Up Arrow icon below, to expand your indicator to full size. The Increase Spacing – Up Arrow button is shown below when you hover over the bottom portion of the chart window.
Removing the indicator from the Chart Analysis window
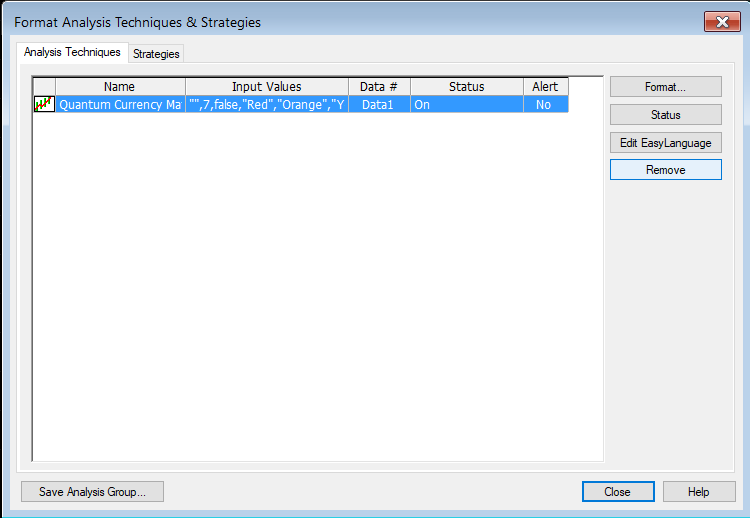
From the menu bar of your TradeStation platform, click Format > Analysis Techniques…
In the Analysis Techniques tab, select Quantum Currency Matrix and click Remove then click Close.
Applying the indicator to RadarScreen
From the Apps menu of your TradeStation platform, please open a RadarScreen window.
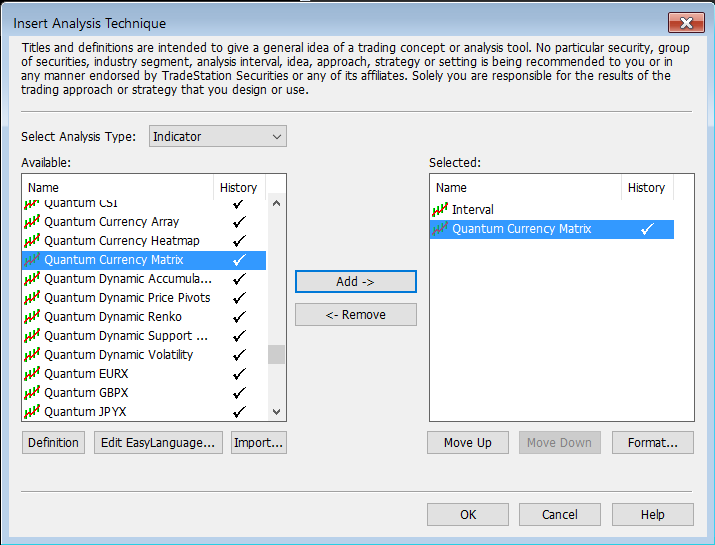
From the menu bar, click Insert > Indicator… > Indicator tab then scroll down at the indicators list at the left hand side and select the Quantum Currency Matrix. Click the Add -> button to apply the indicator in the RadarScreen. You can change the order of the indicators by clicking the Move up and Move down buttons while the indicator is selected in the list at the right hand side.
IMPORTANT: If this is your first time to run Quantum Trading indicators, the indicator will not work until you input your email address in its settings. To do this, please go back to your RadarScreen window and right-click the Quantum Currency Matrix’s column header then select Format ‘Quantum Currency Matrix’ for all Symbols…
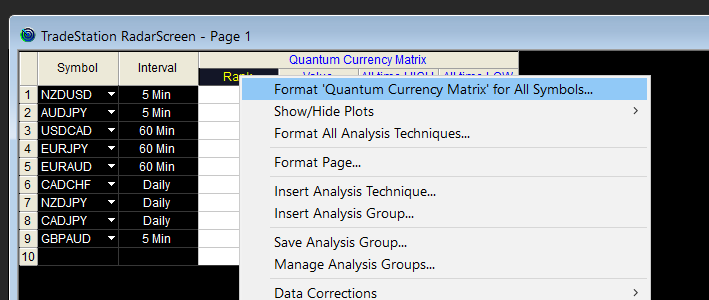
In the Inputs tab, find the MyQuantumTradingEmail input and enter here the email address you used at the Quantum Trading Shop to activate the indicator. PLEASE MAKE SURE TO ENCLOSE THE EMAIL ADDRESS IN DOUBLE QUOTATION MARKS. (example: “myemailaddress@gmail.com”)
Click OK to save and go back to RadarScreen. Please note that you need to do this only once which means you do not need to input your email address again when running Quantum Trading indicators next time.
Compatible symbols in RadarScreen
The indicator works with currency pairs that belong to the combination of the 8 major currencies which are USD, EUR, GBP, CHF, JPY, CAD, AUD and NZD.
RadarScreen columns
Rank
Displays the rank (top to bottom from bullish to bearish) of the currency pair out of the 28 currency pairs in the row’s Interval (timeframe)
Value
Displays the performance score of the currency pair in the current interval (timeframe) within the LookBack period
All time HIGH
Displays the highest score achieved by a currency pair within the LookBack period
All time LOW
Displays the lowest score achieved by a currency pair within the LookBack period
Color changes in the RadarScreen
The cell’s background and text color may change on certain conditions.
Cell background color changes
- Green shades (Rank & Value columns) – the currency pair is at the top part of the matrix (bullish)
- Yellow shades (Rank & Value columns) the currency pair is at the middle part of the matrix
- Red shades (Rank & Value columns) – the currency pair is at the bottom part of the matrix (bearish)
Removing the indicator from RadarScreen
From the RadarScreen window, right-click the Quantum Currency Matrix’s column header then select Delete.
