Overview Of The Trend Monitor Indicator
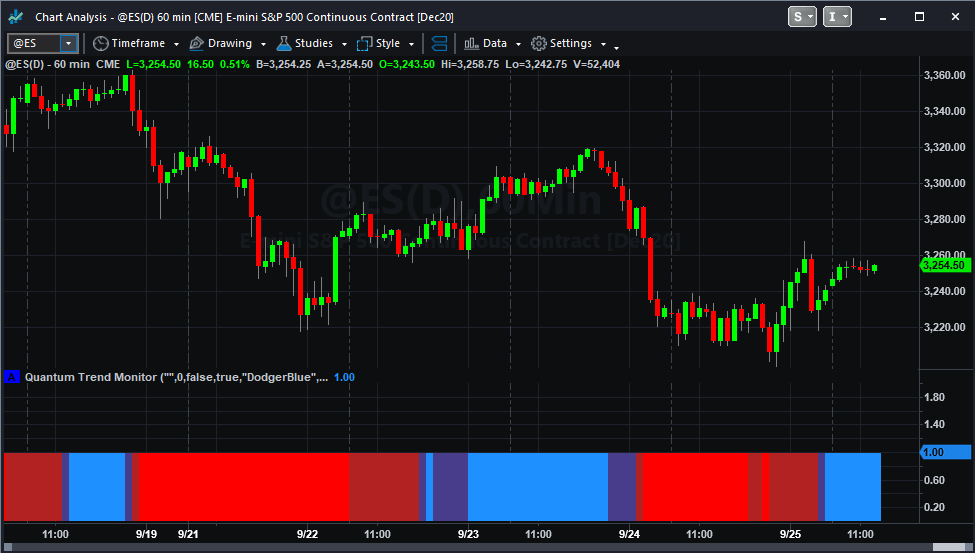
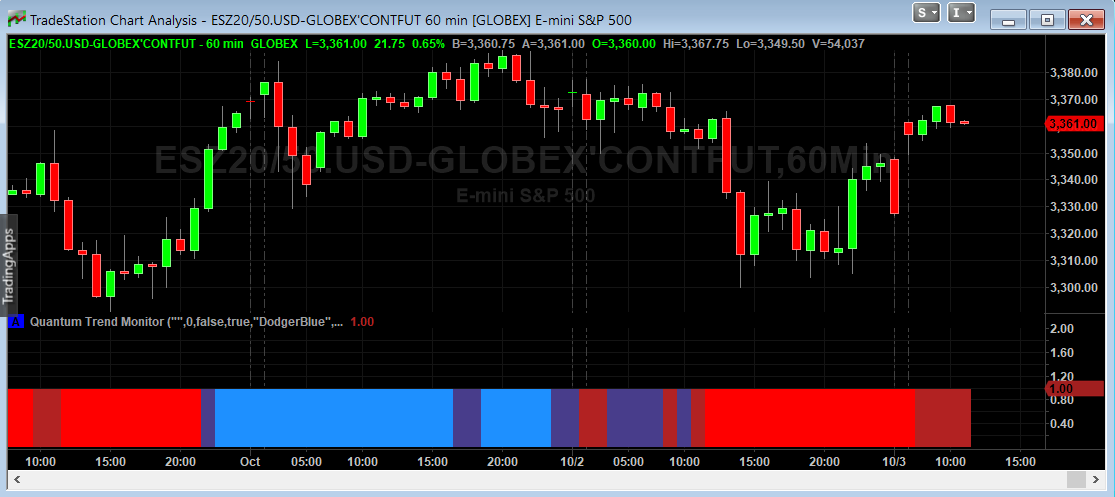
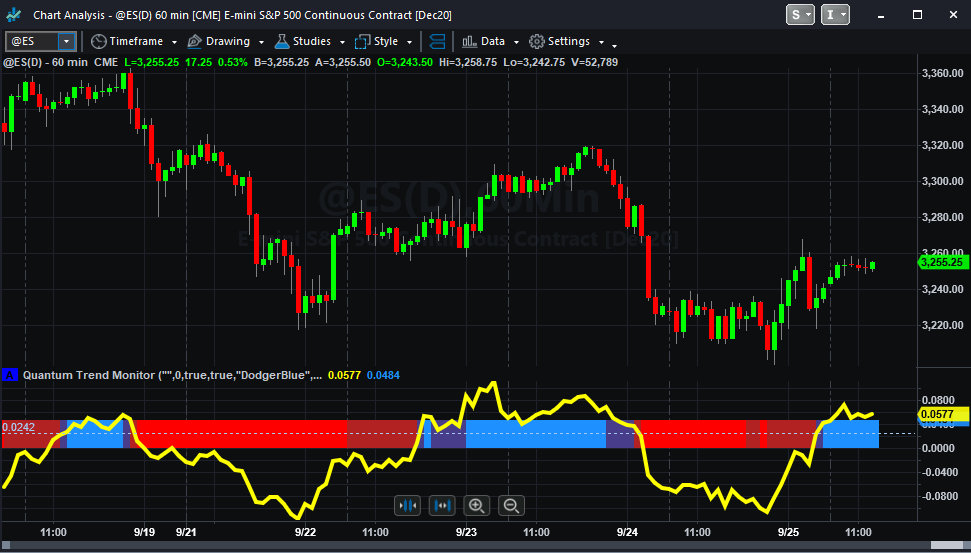
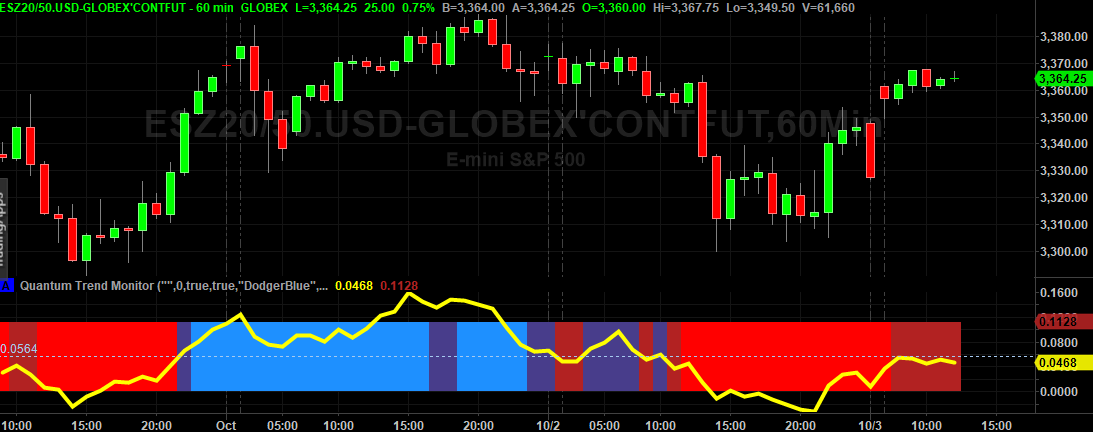
The Quantum Trend Monitor is in fact two indicators in one. It has been designed to help you stay in trends once they begin, but also to signal when a trend is potentially coming to an end, or is simply pausing before continuing further. The indicator is best used in conjunction with the Quantum Trends indicator. The Trend Monitor aims to smooth out the minor pullbacks and reversals which are all part and parcel of the price action, helping to keep you in the trend to maximise the profit potential from every position. This is function of the solid bar, which displays four colors.
When the market is trending strongly, the the Trend Monitor is either bright red or bright blue. When the market is in transition or at a pause point, then the Trend Monitor is either dark red or dark blue. If the Trend Monitor transitions from one bright color to another, ( from red to blue, or form blue to red) then this is signalling that the current trend has potentially come to an end. The Trend Monitor smooths out the ups and downs in a trend, which will be reflected in your Quantum Trends, which then provides the ‘fine detail’ of every move.
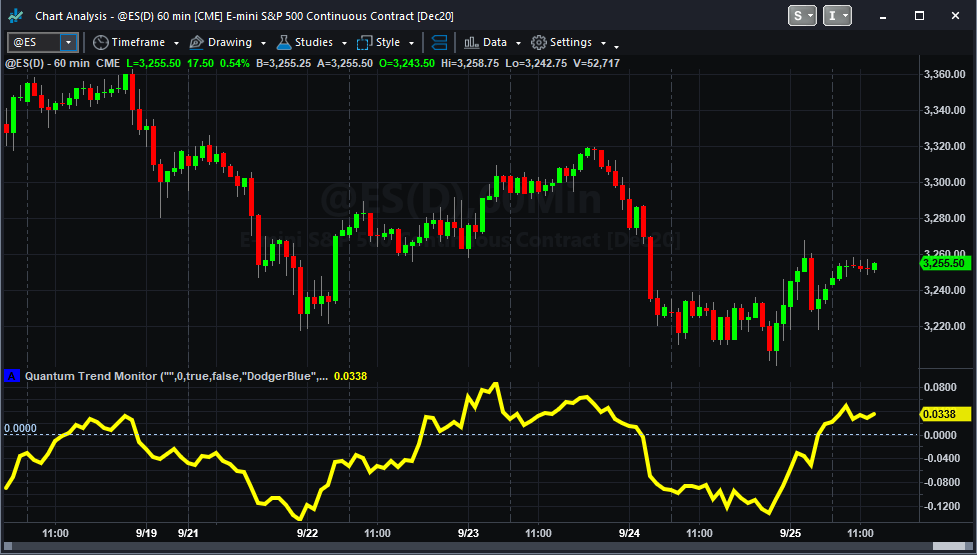
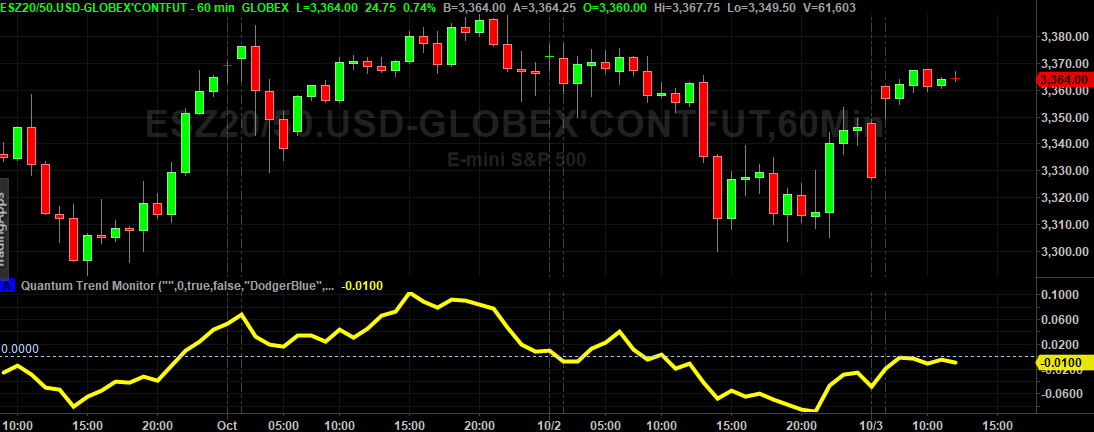
The second element of the Trend Monitor is the yellow trend line, which displays the ‘strength’ of the trend, and gives an additional perspective on the trend. The trend line moves above and below the ‘mean’ which is displayed as a white dotted line on the indicator. As the trend develops, so the yellow trend line moves above and below the mean level, and as it reaches the extremes, then this is another potential signal, that the trend is becoming exhausted. The trend line indicator can be applied directly on the Quantum Trend Monitor itself, as shown above to keep your charts clean and clear, or separately in another window.
As with all the Quantum trading indicators, the Quantum Trend Monitor is best used in multiple timeframes which will then give you visual signals to changes in trend, both upstream and downstream of your principle trading chart.
- The Quantum Trend Monitor indicator works in all timeframes and other chart types
- The indicator can be ‘fine tuned’ to your own preferences in terms of the speed with which the indicator will react to possible changes in trend
- For clarity, we find it is best applied to the bottom of the chart
Using the indicator in TradeStation Securities
Applying the indicator to a Chart Analysis window
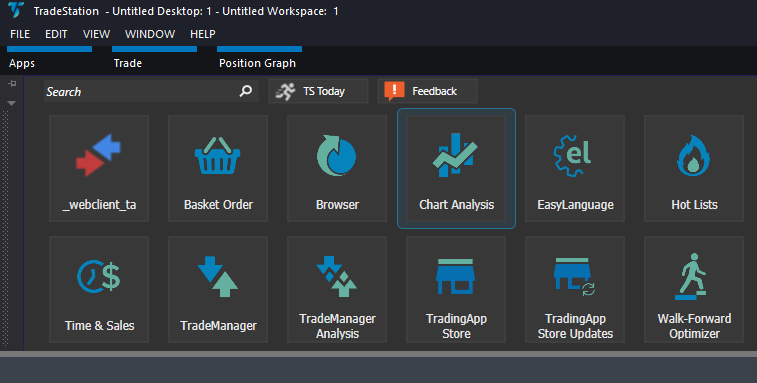
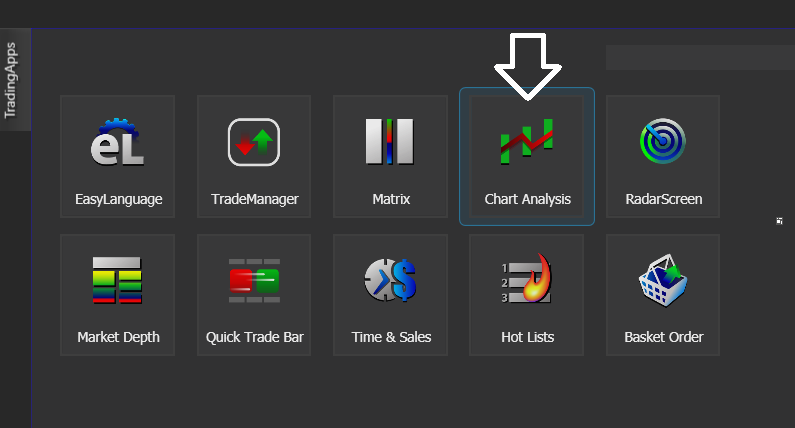
From the Apps menu of your TradeStation platform, please open a Chart Analysis window.
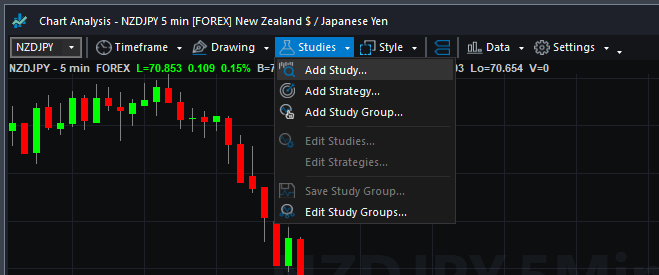
From the Chart Analysis window’s toolbar, please click Studies > Add Study…
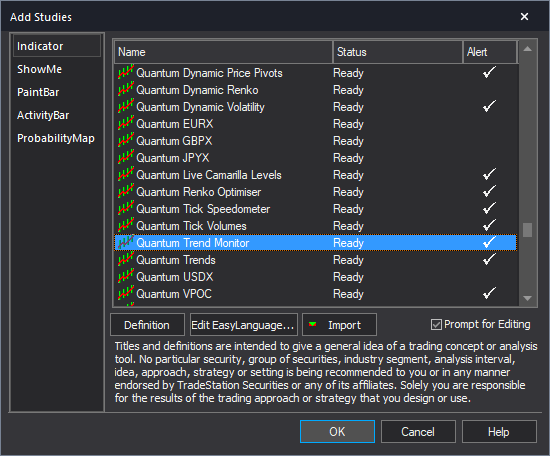
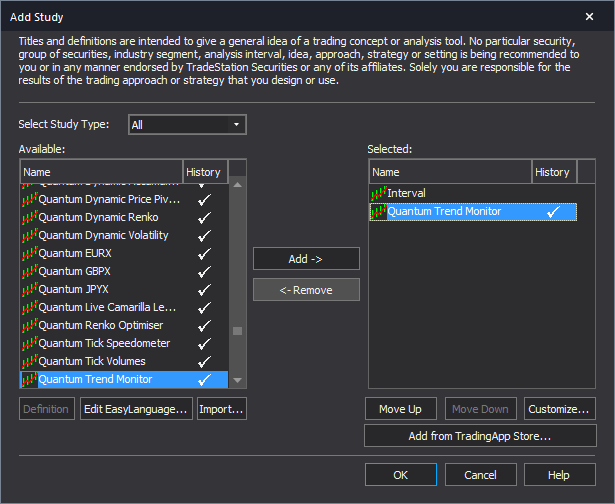
From the Add Study window, please choose Indicator at the left hand side of the interface then at the right, scroll down and select Quantum Trend Monitor. Click OK to apply the indicator to the chart.
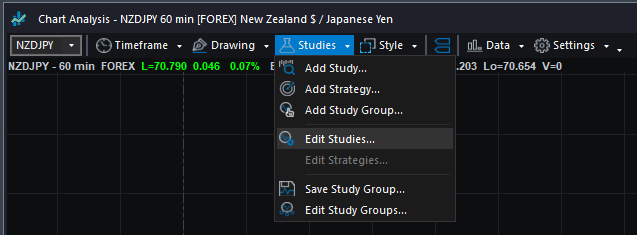
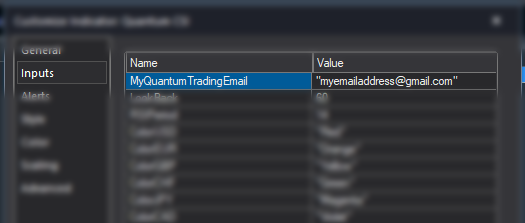
IMPORTANT: If this is your first time to run Quantum Trading indicators, the indicator will not work until you input your email address in its settings. To do this, please go back to your Chart Analysis window and click Studies > Edit Studies…
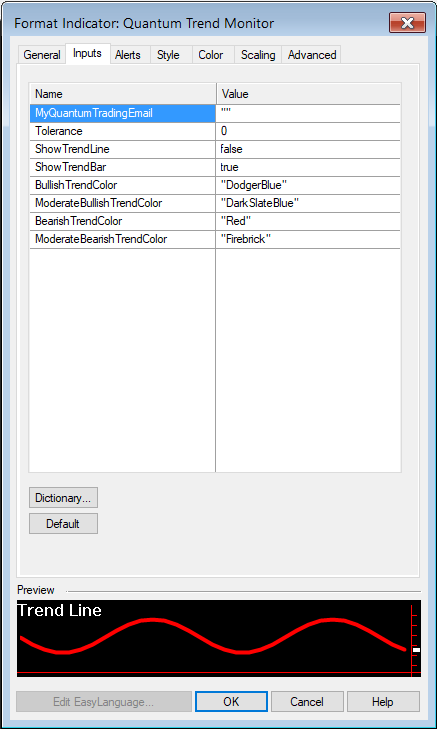
Select the indicator from the list then turn it On by clicking the Status button at the right hand side of the window. Click Customize… or double-click the Quantum Trend Monitor to open the Customize Indicator window. In the Inputs section, find the MyQuantumTradingEmail input and enter here the email address you used at the Quantum Trading Shop to activate the indicator. PLEASE MAKE SURE TO ENCLOSE THE EMAIL ADDRESS IN DOUBLE QUOTATION MARKS. (example: “myemailaddress@gmail.com”)
Click OK (and Close) to save and go back to your chart. Please note that you need to do this only once which means you do not need to input your email address again when running Quantum Trading indicators next time.
Customizing the indicator in Chart Analysis
Inputs
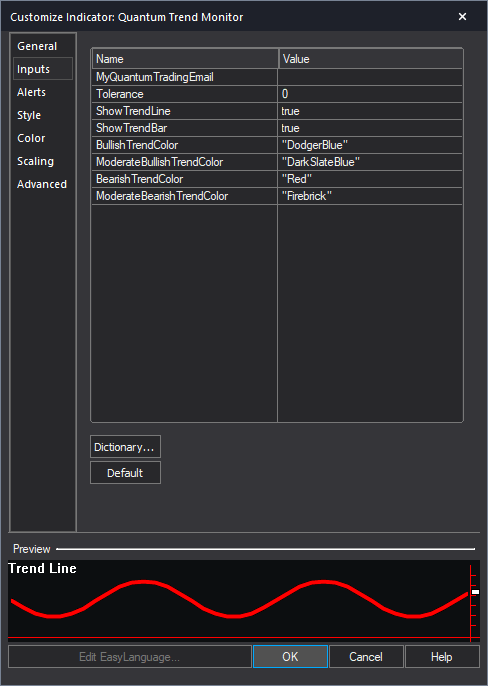
- MyQuantumTradingEmail – When running the indicator for the first time in your TradeStation trading account, you need to enter the email address you used to purchase the indicator in the Quantum Trading Shop as part of its verification process. You need to do this only once as the indicators “remember” your email address by storing it in the local drive. Please make sure that you enter your email address correctly and exactly without any extra spaces before and after it. If you made an error, simply fill this input again to update it. This is a string input which requires you to enclose your email address in double quotation marks (“”).
- Tolerance – This input is a factor used by the indicator to smooth out the noise in the chart’s price action. As you increase its value, easing in and out of stronger trends become more apparent.
- ShowTrendLine – You can show or hide the Trend Line within the Trend Monitor indicator by changing this input’s value to true or false respectively.
- ShowTrendBar – You can show or hide the Trend Bar within the Trend Monitor indicator by changing this input’s value to true or false respectively. If the ShowTrendBar and ShowTrendLine inputs are both true, the indicator will combine together the 2 modes which will shift the Trend Line’s 0 oscillation to level with the Trend Bar.
- BullishTrendColor – This input allows you to change the color of the strong bullish bars in Trend Bar mode. As a string input, you need to enclose the name color in double quotation marks (“”). Named colors are the only accepted values in these inputs which are all listed in the following link – http://help.tradestation.com/09_01/tsdevhelp/Subsystems/elobject/class_win/color_class.htm. The color of a line reverts to the default named color if the input’s value is invalid.
- ModerateBullishTrendColor – This input allows you to change the color of the moderate bullish bars in Trend bar mode. As a string input, you need to enclose the name color in double quotation marks (“”). Named colors are the only accepted values in these inputs which are all listed in the following link – http://help.tradestation.com/09_01/tsdevhelp/Subsystems/elobject/class_win/color_class.htm. The color of a line reverts to the default named color if the input’s value is invalid.
- BearishTrendColor – This input allows you to change the color of the strong bearish bars in Trend Bar mode. As a string input, you need to enclose the name color in double quotation marks (“”). Named colors are the only accepted values in these inputs which are all listed in the following link – http://help.tradestation.com/09_01/tsdevhelp/Subsystems/elobject/class_win/color_class.htm. The color of a line reverts to the default named color if the input’s value is invalid.
- ModerateBearishTrendColor – This input allows you to change the color of the moderate bearish bars in Trend Bar mode. As a string input, you need to enclose the name color in double quotation marks (“”). Named colors are the only accepted values in these inputs which are all listed in the following link – http://help.tradestation.com/09_01/tsdevhelp/Subsystems/elobject/class_win/color_class.htm. The color of a line reverts to the default named color if the input’s value is invalid.
General
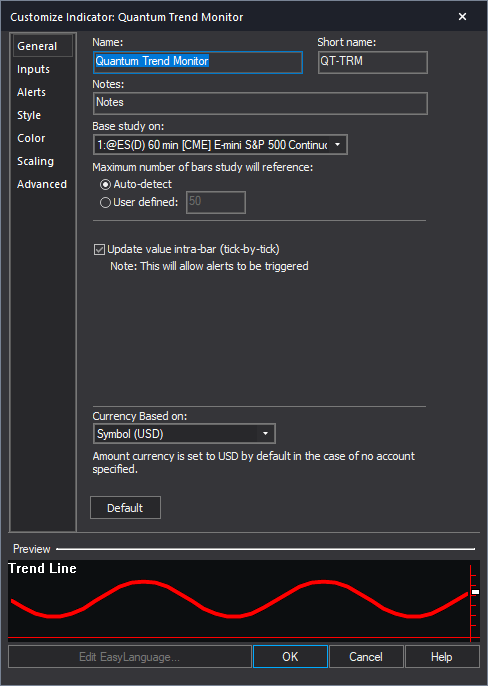
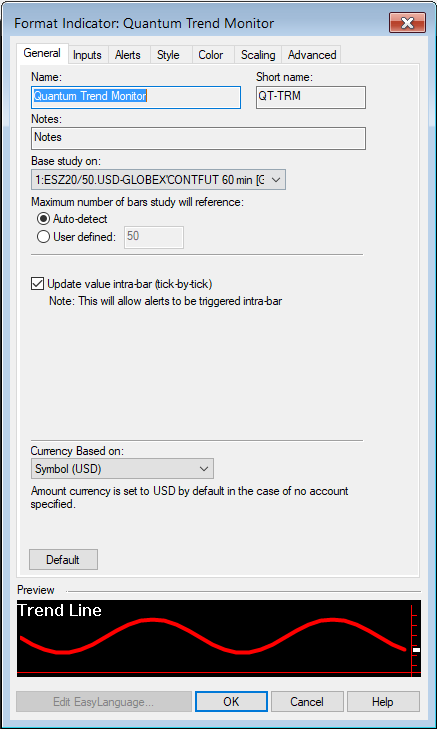
You can modify the name, short name, notes, maximum number of bars the indicator will reference, and more. We do not recommend changing any of the settings in this section but you can learn more about the different options in the General tab in TradeStation’s help guide at the link below.
http://help.tradestation.com/10_00/eng/tradestationhelp/study/customize_study_general.htm
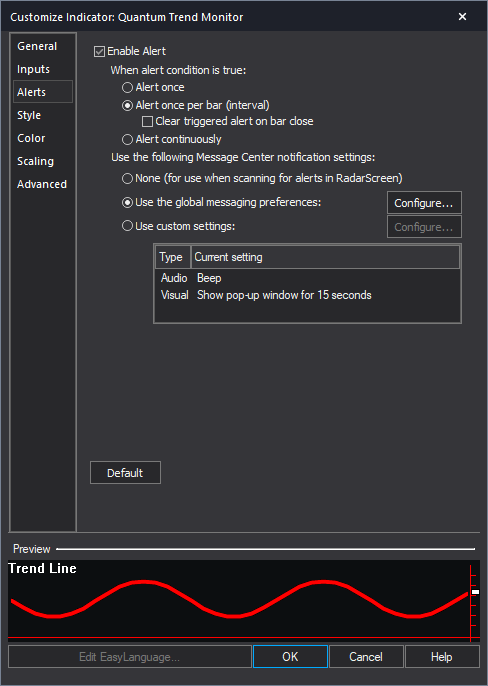
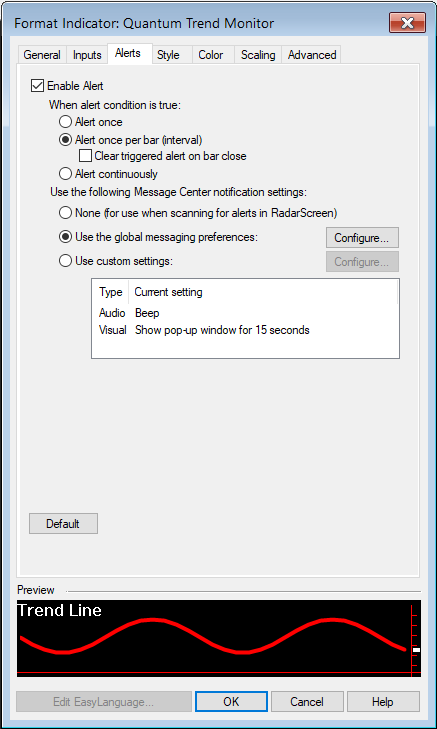
Alerts
The Quantum Trend Monitor triggers alerts when there is change in the current trend or when a new trend starts.
You can learn more about the different options in the Alerts tab in TradeStation’s help guide at the link below.
http://help.tradestation.com/10_00/eng/tradestationhelp/study/customize_study_alerts.htm
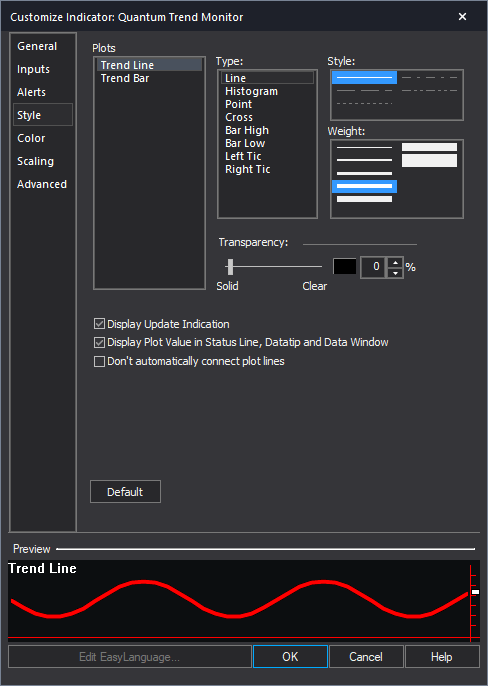
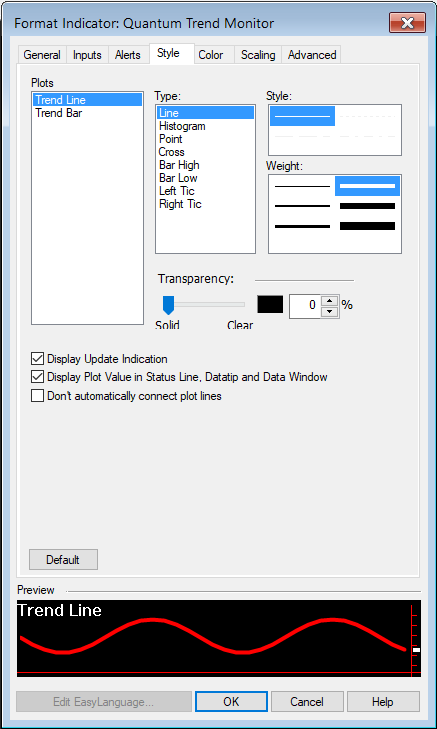
Style
The indicator uses 2 plots but only the Trend Line plot can be customized.
You can learn more about the different options in the Style tab in TradeStation’s help guide at the link below.
http://help.tradestation.com/10_00/eng/tradestationhelp/study/customize_study_style.htm
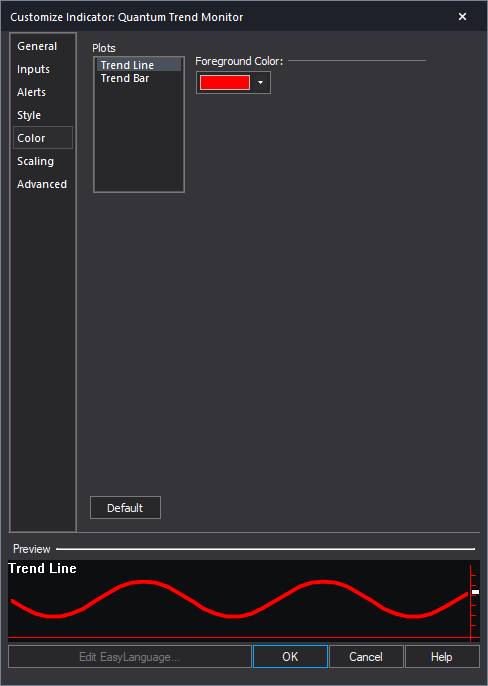
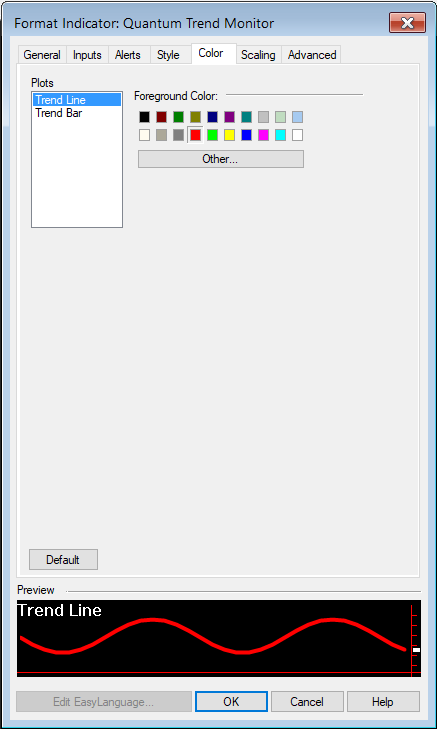
Color
The indicator uses 2 plots but only the Trend Line plot can be changed to another color in this section. To change the colors of the Trend Bar plot, please change the value of the “…Color” inputs.
You can learn more about the different options in the Color tab in TradeStation’s help guide at the link below.
http://help.tradestation.com/10_00/eng/tradestationhelp/study/customize_study_color.htm
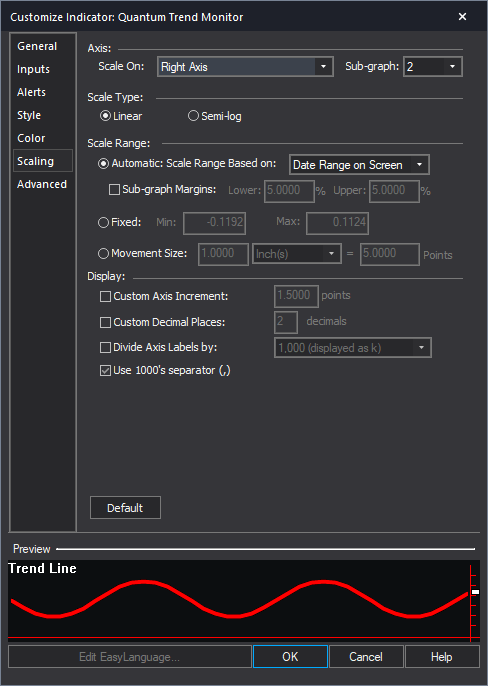
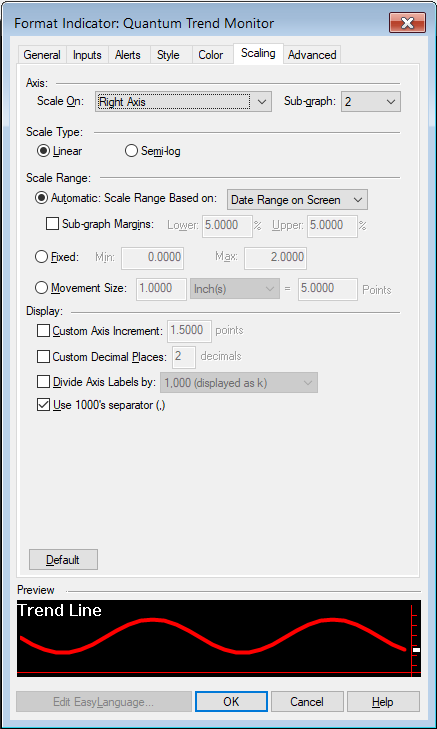
Scaling
The Scaling tab is used to modify the scaling settings for the y-axis of the indicator in the active Chart Analysis window. We do not recommend changing any of the settings in this section but you can learn more about the different options in the Scaling tab in TradeStation’s help guide at the link below.
http://help.tradestation.com/10_00/eng/tradestationhelp/study/customize_study_scaling.htm
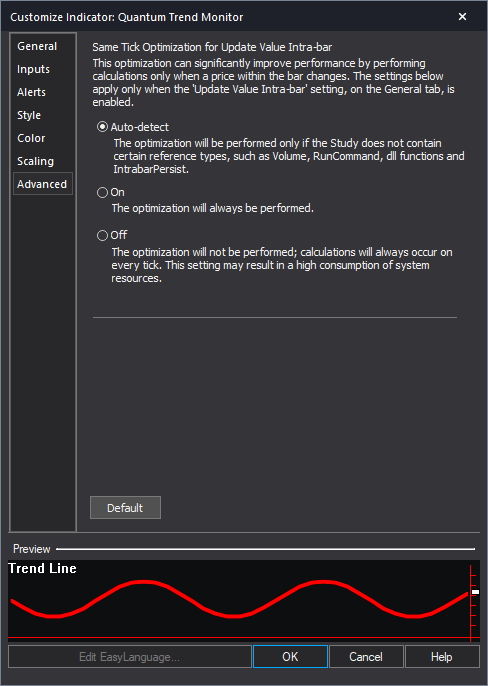
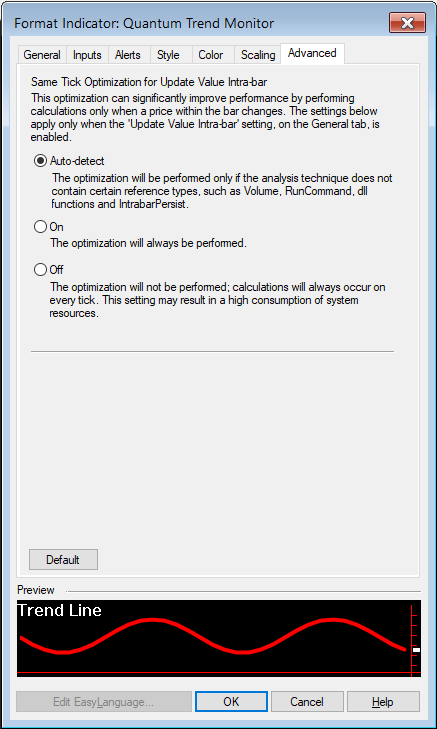
Advanced
The Advanced tab allows you to set advanced preferences for the indicator. We do not recommend changing any of the settings in this section but you can learn more about the different options in the Advanced tab in TradeStation’s help guide at the link below.
http://help.tradestation.com/10_00/eng/tradestationhelp/study/customize_study_advanced.htm
Removing the indicator from the Chart Analysis window
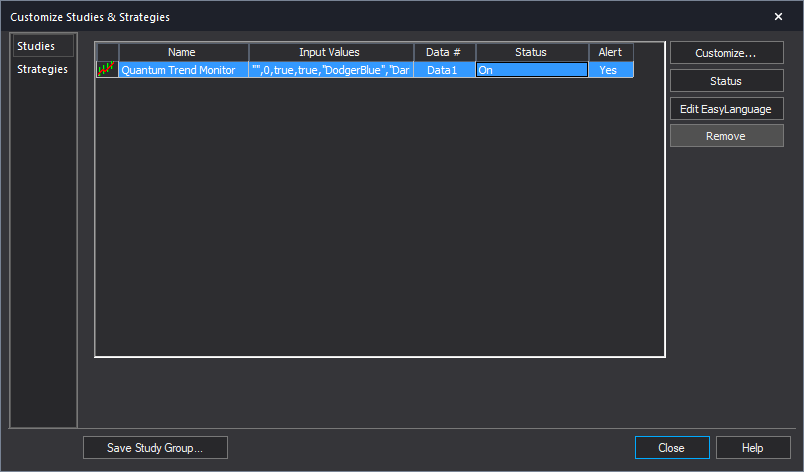
From the Chart Analysis window’s toolbar, please click Studies > Edit Studies…
In the Studies tab, select Quantum Trend Monitor and click Remove then click Close.
Applying the indicator to RadarScreen
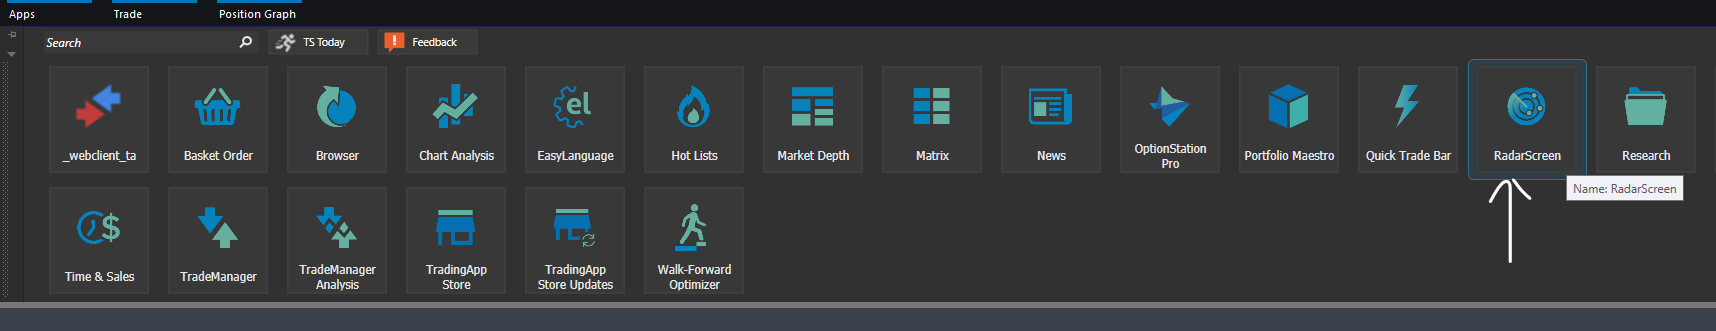
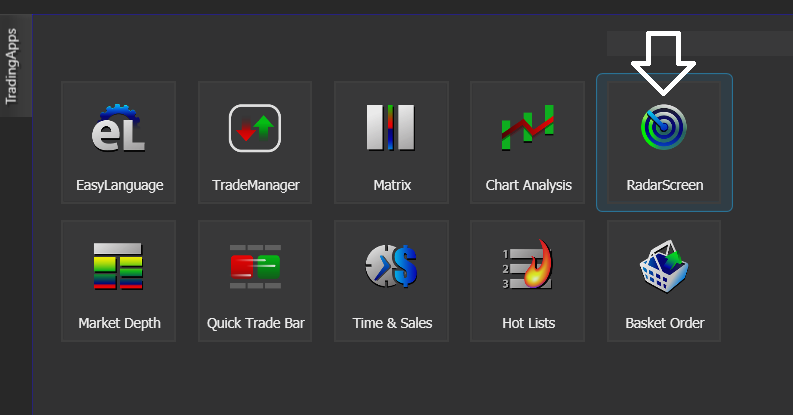
From the Apps menu of your TradeStation platform, please open a RadarScreen window.
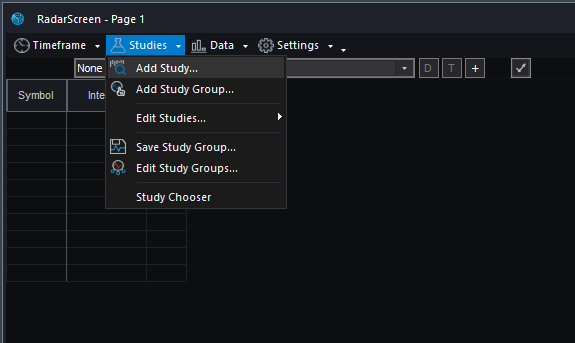
From the RadarScreen window’s toolbar, please click Studies > Add Study…
From the Add Study window, please choose Indicator at the left hand side of the interface then at the right, scroll down and select Quantum Trend Monitor. Click OK to apply the indicator to the chart.

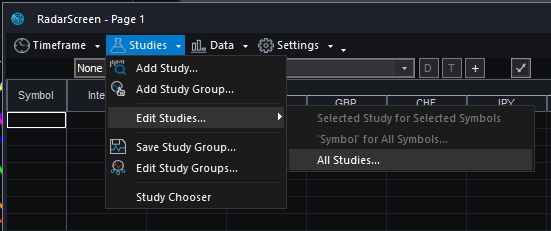
IMPORTANT: If this is your first time to run Quantum Trading indicators, the indicator will not work until you input your email address in its settings. To do this, please go back to your RadarScreen window and click Studies > Edit Studies… > All Studies…
Double-click the Quantum Trend Monitor to open the Customize Indicator window. In the Inputs section, find the MyQuantumTradingEmail input and enter here the email address you used at the Quantum Trading Shop to activate the indicator. PLEASE MAKE SURE TO ENCLOSE THE EMAIL ADDRESS IN DOUBLE QUOTATION MARKS. (example: “myemailaddress@gmail.com”)
Click OK (and Close) to save and go back to RadarScreen. Please note that you need to do this only once which means you do not need to input your email address again when running Quantum Trading indicators next time.
Compatible symbols in RadarScreen
The Quantum Trend Monitor indicator works with any symbol.
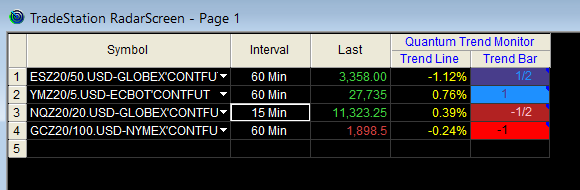
RadarScreen columns
Trend Line
Displays the current value of the Trend Line (expressed in percent)
Trend Bar
Displays the current state of the trend bar.
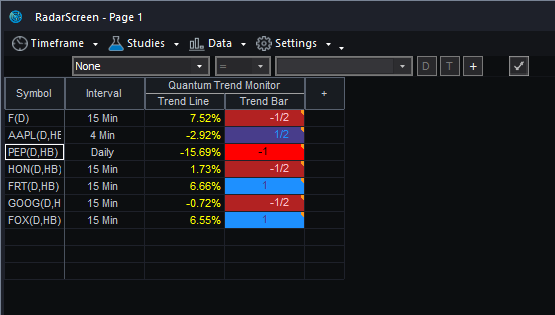
Color changes in the RadarScreen
The cell’s background and text color may change on certain conditions.
Background color changes
- The Trend Bar column changes color depending on its current value
- Blue 1 – when the trend is bullish and strong
- Red 1 – when the trend is bearish and strong
- Dark blue ½ – when the trend is bullish but weak
- Dark red ½ – when the trend is bearish but weak
Removing the indicator from RadarScreen
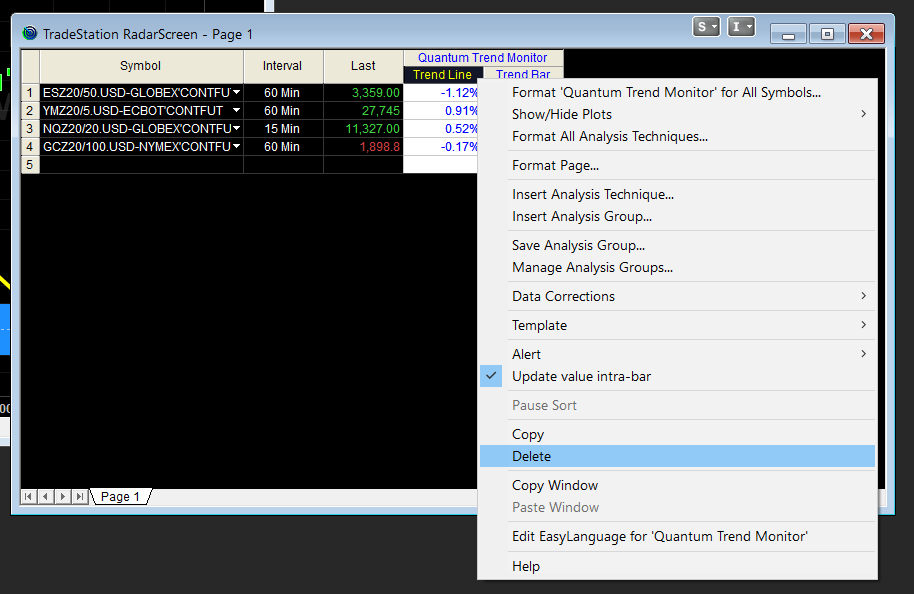
From the RadarScreen window’s toolbar, please click Studies > Edit Study… > All Studies… then select/click Quantum Trend Monitor in the list at right hand side of the window. Click the “<- Remove” button then click OK to close the window.
Using the indicator in TradeStation Global
Applying the indicator to a Chart Analysis window
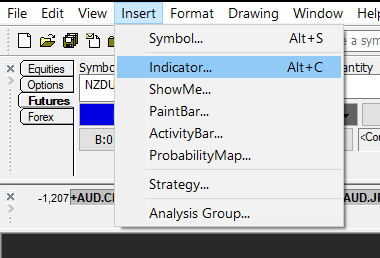
From the Apps menu of your TradeStation platform, please open a Chart Analysis window.
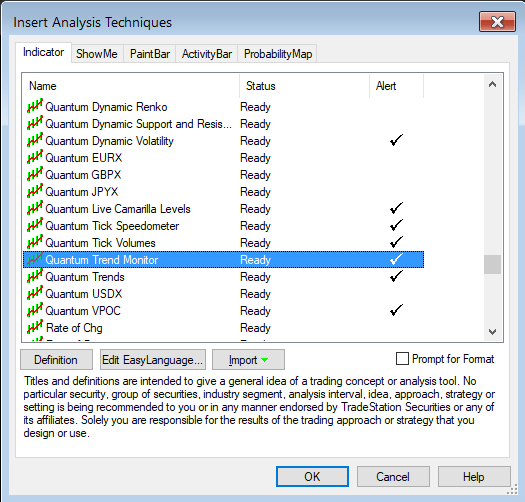
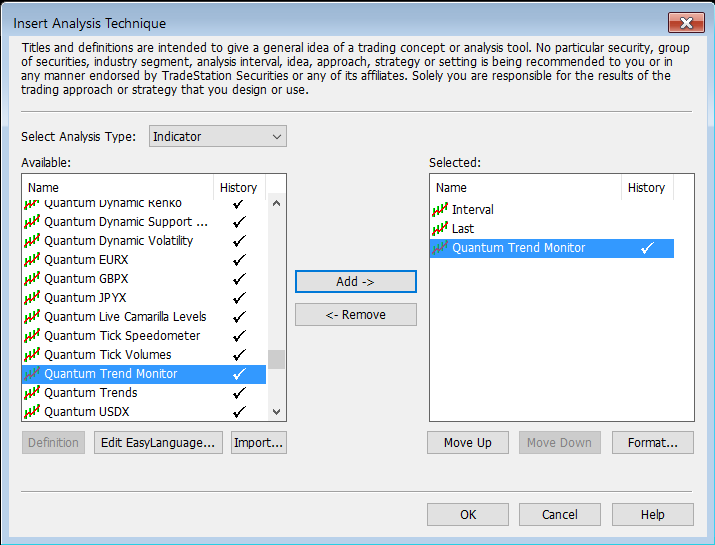
From the menu bar, click Insert > Indicator… > Indicator tab then scroll down at the list and select the Quantum Trend Monitor and click OK to apply the indicator in the chart.
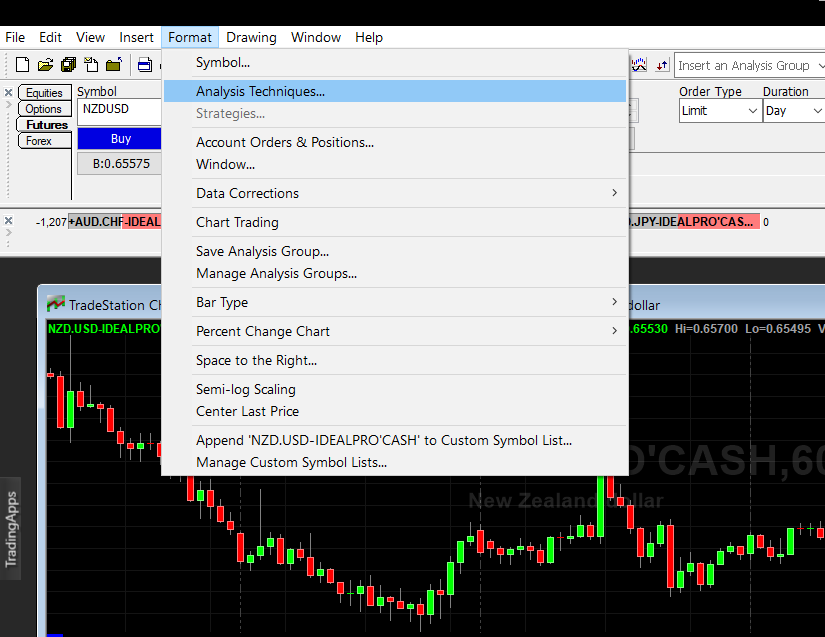
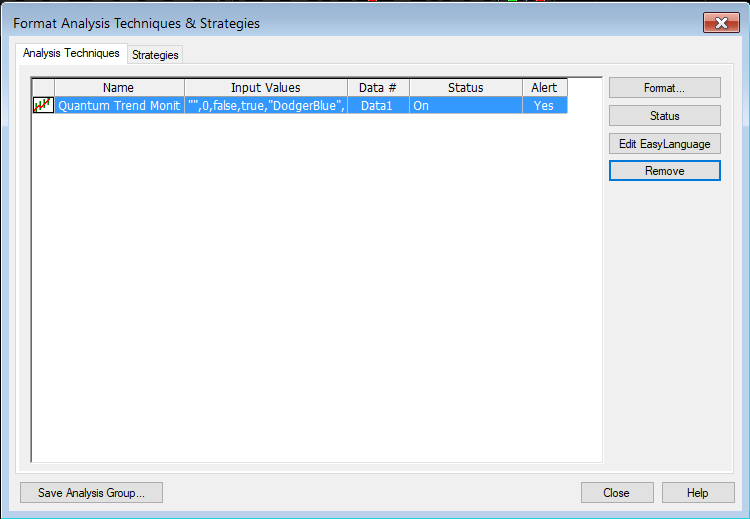
IMPORTANT: If this is your first time to run Quantum Trading indicators, the indicator will not work until you input your email address in its settings. To do this, please go back to your Chart Analysis window then in the menu bar, click Format > Analysis Techniques…
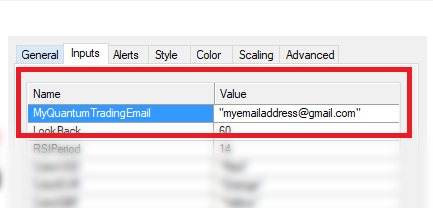
Select the indicator from the list then turn it On by clicking the Status button at the right hand side of the window. Click Format… or double-click the Quantum Trend Monitor to open the Format Indicator window. In the Inputs section, find the MyQuantumTradingEmail input and enter here the email address you used at the Quantum Trading Shop to activate the indicator. PLEASE MAKE SURE TO ENCLOSE THE EMAIL ADDRESS IN DOUBLE QUOTATION MARKS. (example: “myemailaddress@gmail.com”)
Click OK (and Close) to save and go back to your chart. Please note that you need to do this only once which means you do not need to input your email address again when running Quantum Trading indicators next time.
Customizing the indicator in Chart Analysis
Inputs
- MyQuantumTradingEmail – When running the indicator for the first time in your TradeStation trading account, you need to enter the email address you used to purchase the indicator in the Quantum Trading Shop as part of its verification process. You need to do this only once as the indicators “remember” your email address by storing it in the local drive. Please make sure that you enter your email address correctly and exactly without any extra spaces before and after it. If you made an error, simply fill this input again to update it. This is a string input which requires you to enclose your email address in double quotation marks (“”).
- Tolerance – This input is a factor used by the indicator to smooth out the noise in the chart’s price action. As you increase its value, easing in and out of stronger trends become more apparent.
- ShowTrendLine – You can show or hide the Trend Line within the Trend Monitor indicator by changing this input’s value to true or false respectively.
- ShowTrendBar – You can show or hide the Trend Bar within the Trend Monitor indicator by changing this input’s value to true or false respectively. If the ShowTrendBar and ShowTrendLine inputs are both true, the indicator will combine together the 2 modes which will shift the Trend Line’s 0 oscillation to level with the Trend Bar.
- BullishTrendColor – This input allows you to change the color of the strong bullish bars in Trend Bar mode. As a string input, you need to enclose the name color in double quotation marks (“”). Named colors are the only accepted values in these inputs which are all listed in the following link – http://help.tradestation.com/09_01/tsdevhelp/Subsystems/elobject/class_win/color_class.htm. The color of a line reverts to the default named color if the input’s value is invalid.
- ModerateBullishTrendColor – This input allows you to change the color of the moderate bullish bars in Trend bar mode. As a string input, you need to enclose the name color in double quotation marks (“”). Named colors are the only accepted values in these inputs which are all listed in the following link – http://help.tradestation.com/09_01/tsdevhelp/Subsystems/elobject/class_win/color_class.htm. The color of a line reverts to the default named color if the input’s value is invalid.
- BearishTrendColor – This input allows you to change the color of the strong bearish bars in Trend Bar mode. As a string input, you need to enclose the name color in double quotation marks (“”). Named colors are the only accepted values in these inputs which are all listed in the following link – http://help.tradestation.com/09_01/tsdevhelp/Subsystems/elobject/class_win/color_class.htm. The color of a line reverts to the default named color if the input’s value is invalid.
- ModerateBearishTrendColor – This input allows you to change the color of the moderate bearish bars in Trend Bar mode. As a string input, you need to enclose the name color in double quotation marks (“”). Named colors are the only accepted values in these inputs which are all listed in the following link – http://help.tradestation.com/09_01/tsdevhelp/Subsystems/elobject/class_win/color_class.htm. The color of a line reverts to the default named color if the input’s value is invalid.
General
You can modify the name, short name, notes, maximum number of bars the indicator will reference, and more. We do not recommend changing any of the settings in this section but you can learn more about the different options in the General tab in TradeStation’s help guide at the link below.
Alerts
The Quantum Trend Monitor triggers alerts when there is change in the current trend or when a new trend starts.
You can learn more about the different options in the Alerts tab in TradeStation’s help guide at the link below.
Style
The indicator uses 2 plots but only the Trend Line plot can be customized.
You can learn more about the different options in the Style tab in TradeStation’s help guide at the link below.
Color
The indicator uses 2 plots but only the Trend Line plot can be changed to another color in this section. To change the colors of the Trend Bar plot, please change the value of the “…Color” inputs.
You can learn more about the different options in the Color tab in TradeStation’s help guide at the link below.
Scaling
he Scaling tab is used to modify the scaling settings for the y-axis of the indicator in the active Chart Analysis window. We do not recommend changing any of the settings in this section but you can learn more about the different options in the Scaling tab in TradeStation’s help guide at the link below.
Advanced
The Advanced tab allows you to set advanced preferences for the indicator. We do not recommend changing any of the settings in this section but you can learn more about the different options in the Advanced tab in TradeStation’s help guide at the link below.
Removing the indicator from the Chart Analysis window
From the menu bar of your TradeStation platform, click Format > Analysis Techniques…
In the Analysis Techniques tab, select Quantum Trend Monitor and click Remove then click Close.
Applying the indicator to RadarScreen
From the Apps menu of your TradeStation platform, please open a RadarScreen window.
From the menu bar, click Insert > Indicator… > Indicator tab then scroll down at the indicators list at the left hand side and select the Quantum Trend Monitor. Click the Add -> button to apply the indicator in the RadarScreen. You can change the order of the indicators by clicking the Move up and Move down buttons while the indicator is selected in the list at the right hand side.
IMPORTANT: If this is your first time to run Quantum Trading indicators, the indicator will not work until you input your email address in its settings. To do this, please go back to your RadarScreen window and right-click the Quantum Trend Monitor’s column header then select Format ‘Quantum Trend Monitor’ for all Symbols…
In the Inputs tab, find the MyQuantumTradingEmail input and enter here the email address you used at the Quantum Trading Shop to activate the indicator. PLEASE MAKE SURE TO ENCLOSE THE EMAIL ADDRESS IN DOUBLE QUOTATION MARKS. (example: “myemailaddress@gmail.com”)
Click OK to save and go back to RadarScreen. Please note that you need to do this only once which means you do not need to input your email address again when running Quantum Trading indicators next time.
Compatible symbols in RadarScreen
The Quantum Trend Monitor indicator works with any symbol.
RadarScreen columns
Trend Line
Displays the current value of the Trend Line (expressed in percent)
Trend Bar
Displays the current state of the trend bar.
Color changes in the RadarScreen
The cell’s background and text color may change on certain conditions.
Background color changes
- The Trend Bar column changes color depending on its current value
- Blue 1 – when the trend is bullish and strong
- Red 1 – when the trend is bearish and strong
- Dark blue ½ – when the trend is bullish but weak
- Dark red ½ – when the trend is bearish but weak
Removing the indicator from RadarScreen
From the RadarScreen window, right-click the Quantum Trend Monitor’s column header then select Delete.