Overview of The Dynamic Volatility Indicator
For ships at sea, the lighthouse flashing its constant signals is a warning of one thing – danger ahead. The Quantum Dynamic Volatility indicator is the traders lighthouse. It is warning of possible danger ahead, signalling extreme volatility in the market, and potential hazards for the unwary trader.
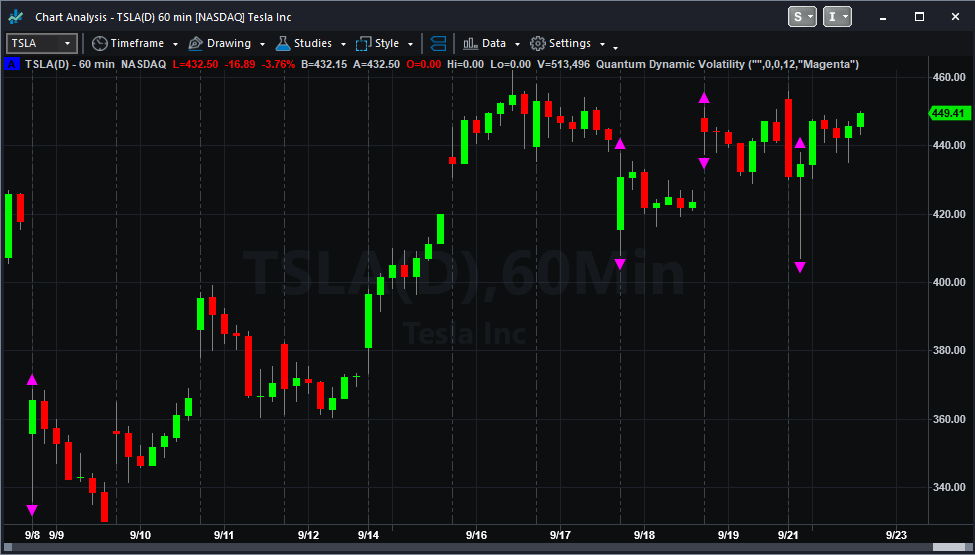
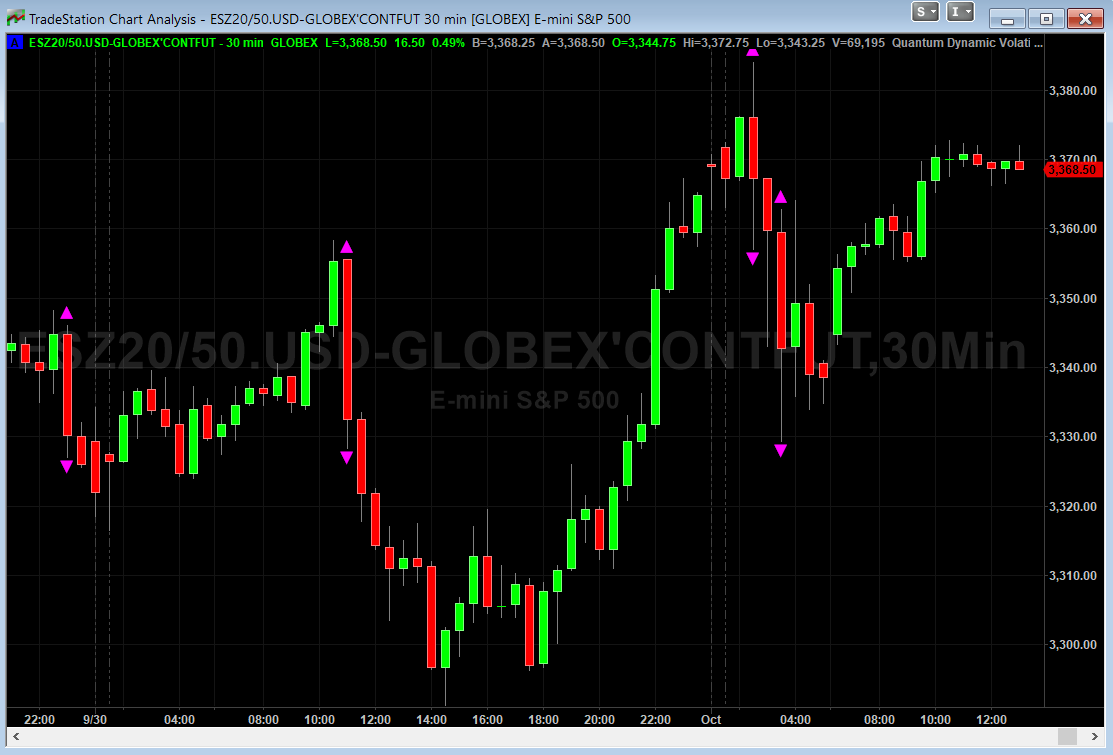
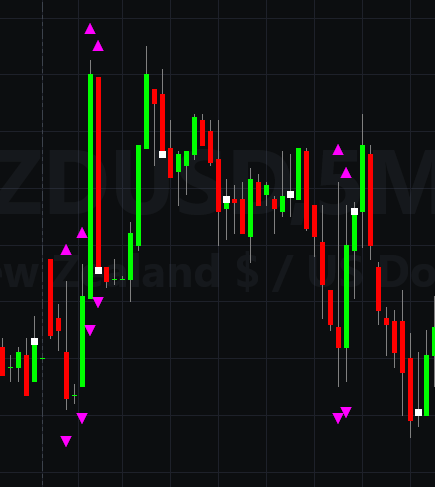
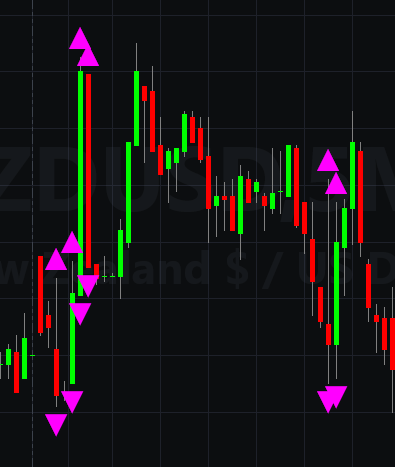
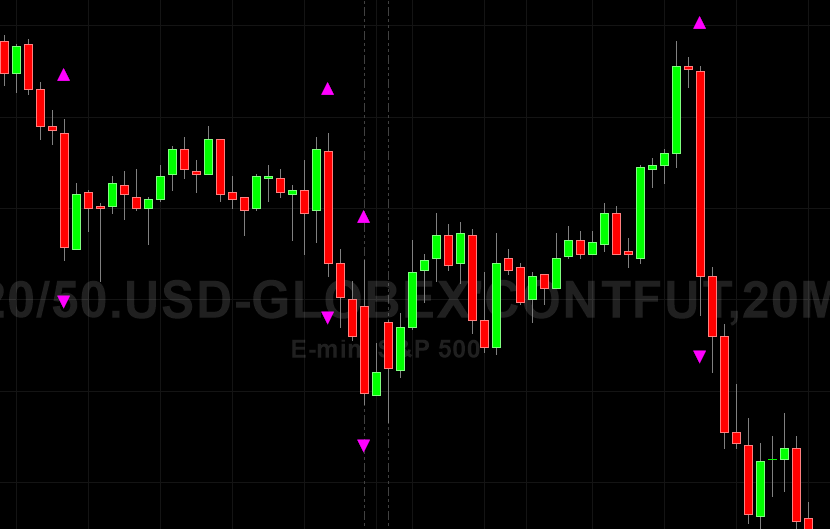
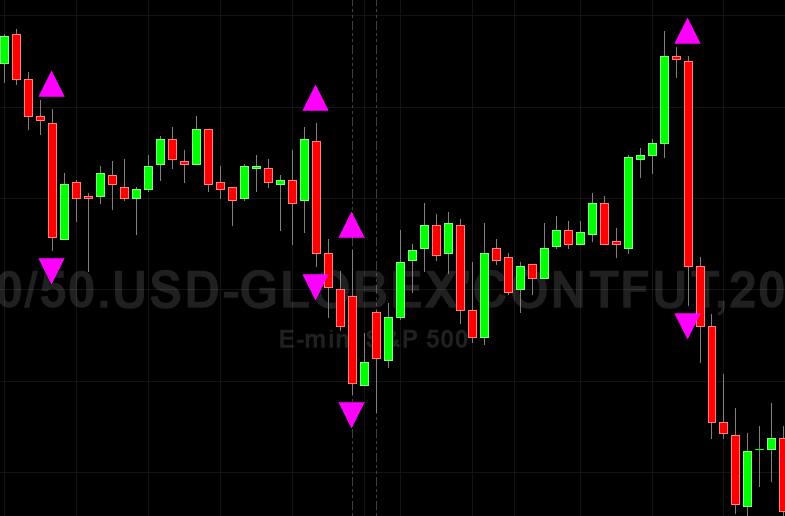
The indicator signals this volatility, using average true range. It is constantly scanning the price action for extremes, and when they arrive, are signaled on the chart with a purple arrow, above and below the candle. This is a warning signal to stay out. What often happens following these periods of volatility is that the price action then retraces, and trades within the spread of the candle or bar. The reason for this is easy to understand. The market has moved sharply higher or lower on a news release. Excited forex traders then jump into the move, hoping for some easy money. The market makers then reverse the price action, leaving these trader trapped in weak positions.
This happens repeatedly and is the reason that the we developed the indicator. To signal these volatile bars and candles in realtime, and the associated warning to take care. Generally, once the signal is triggered, you will find the market moving back into the range of the bar or candle, before moving breaking higher or lower in due course. Once the price action has been validated by a clear move away, then it is safe to consider taking a position in the market once again.
The Quantum Dynamic Volatility indicator is sending a clear warning. It’s warning of high risk, and telling you to take care. The indicator paints two arrows, one above and one below the candle or bar.
The Quantum Dynamic Volatility indicator works in time based charts and other chart types.
Using the indicator in TradeStation Securities
Applying the indicator to a Chart Analysis window
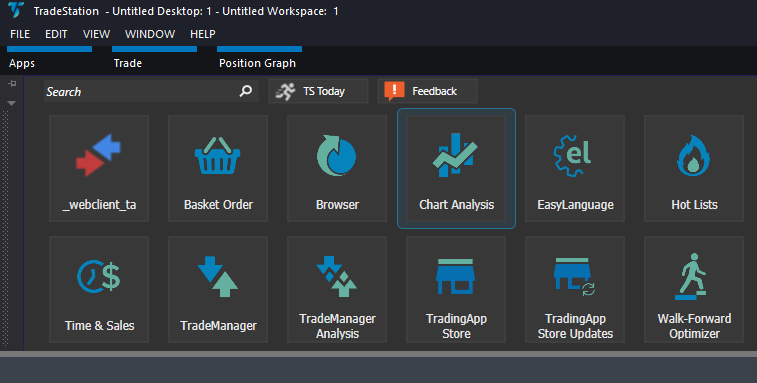
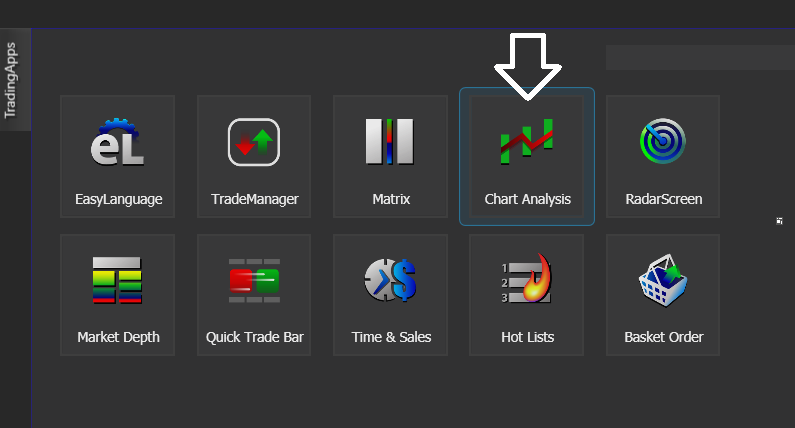
From the Apps menu of your TradeStation platform, please open a Chart Analysis window.
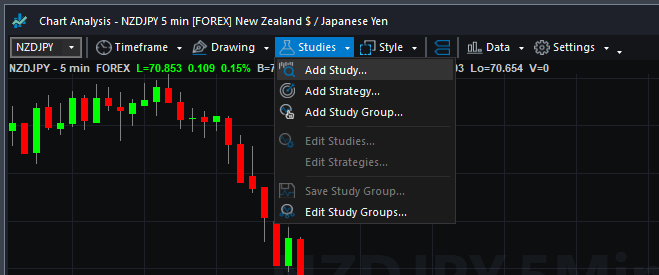
From the Chart Analysis window’s toolbar, please click Studies > Add Study…
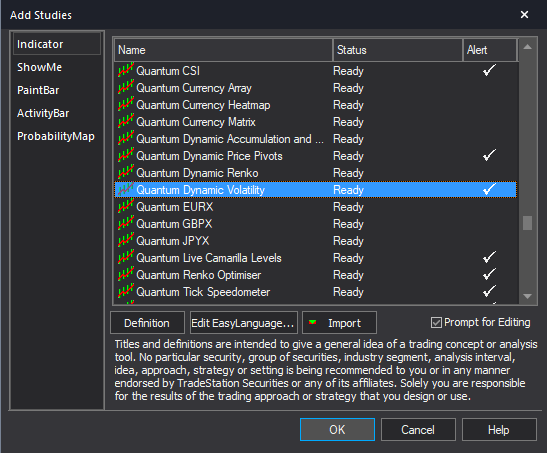
From the Add Study window, please choose Indicator at the left hand side of the interface then at the right, scroll down and select Quantum Dynamic Volatility. Click OK to apply the indicator to the chart.
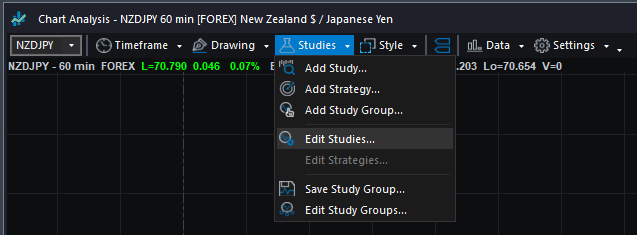
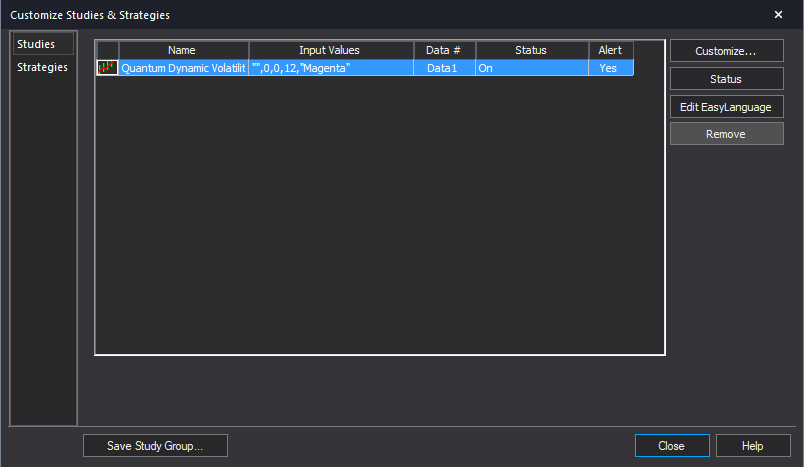
IMPORTANT: If this is your first time to run Quantum Trading indicators, the indicator will not work until you input your email address in its settings. To do this, please go back to your Chart Analysis window and click Studies > Edit Studies…
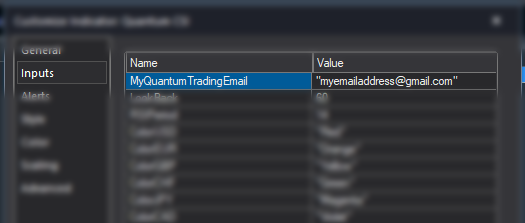
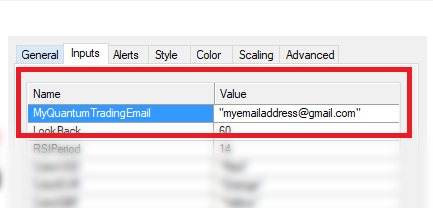
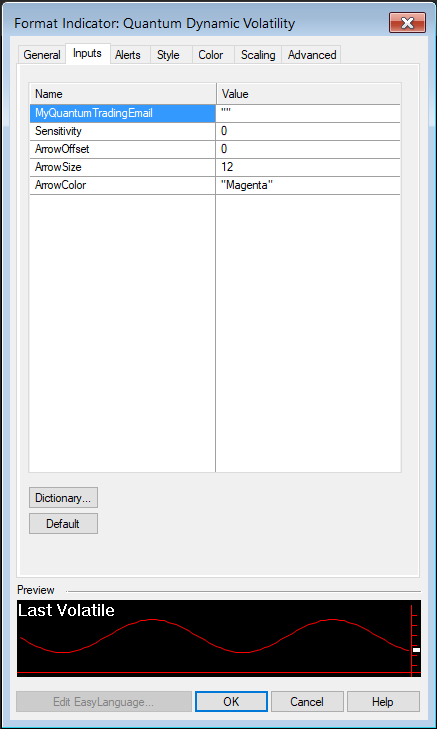
Select the indicator from the list then turn it On by clicking the Status button at the right hand side of the window. Click Customize… or double-click the Quantum Dynamic Volatility to open the Customize Indicator window. In the Inputs section, find the MyQuantumTradingEmail input and enter here the email address you used at the Quantum Trading Shop to activate the indicator. PLEASE MAKE SURE TO ENCLOSE THE EMAIL ADDRESS IN DOUBLE QUOTATION MARKS. (example: “myemailaddress@gmail.com”)
Click OK (and Close) to save and go back to your chart. Please note that you need to do this only once which means you do not need to input your email address again when running Quantum Trading indicators next time.
Customizing the indicator in Chart Analysis
Inputs
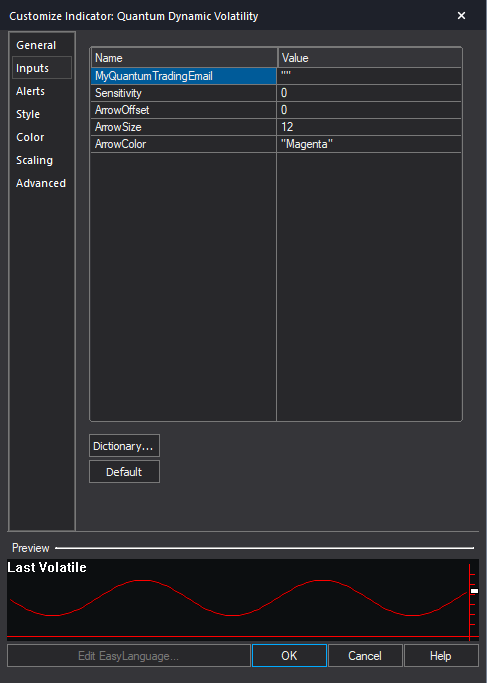
- MyQuantumTradingEmail – When running the indicator for the first time in your TradeStation trading account, you need to enter the email address you used to purchase the indicator in the Quantum Trading Shop as part of its verification process. You need to do this only once as the indicators “remember” your email address by storing it in the local drive. Please make sure that you enter your email address correctly and exactly without any extra spaces before and after it. If you made an error, simply fill this input again to update it. This is a string input which requires you to enclose your email address in double quotation marks (“”).
- Sensitivity – Increasing the value of this input by increments of 1 allows the indicator to become more sensitive to bars that exhibit volatility.
- ArrowOffset – You can add space between the arrow plots and the candlestick by increasing value of this input.
- ArrowSize – This input controls the size of the arrows.
- ArrowColor – This input defines the color of the arrows. As a string input, you need to enclose the name color in double quotation marks (“”). Named colors are the only accepted values in these inputs which are all listed in the following link – http://help.tradestation.com/09_01/tsdevhelp/Subsystems/elobject/class_win/color_class.htm. The color of a line reverts to the default named color if the input’s value is invalid.
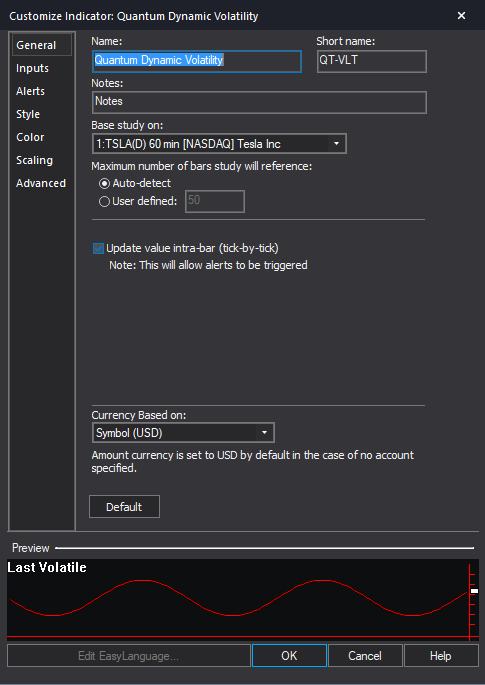
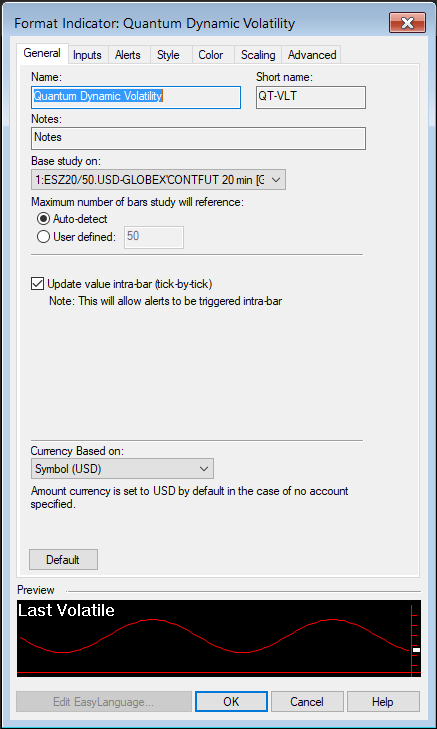
General
You can modify the name, short name, notes, maximum number of bars the indicator will reference, and more. We do not recommend changing any of the settings in this section but you can learn more about the different options in the General tab in TradeStation’s help guide at the link below.
http://help.tradestation.com/10_00/eng/tradestationhelp/study/customize_study_general.htm
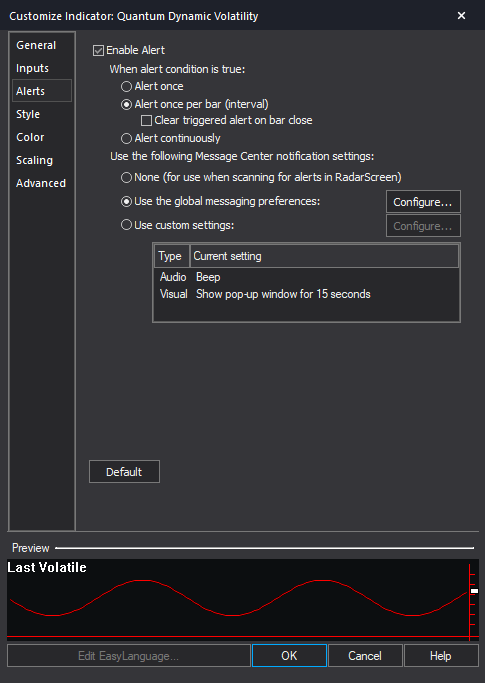
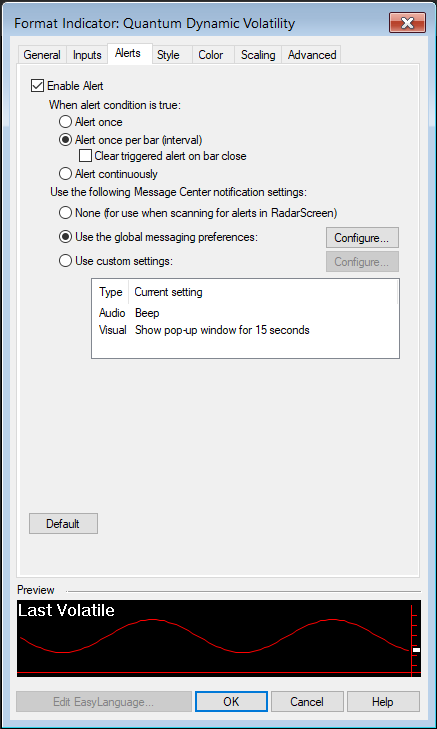
Alerts
This section controls the alert functions of the indicator. Alerts trigger every time a signal is detected.
You can learn more about the different options in the Alerts tab in TradeStation’s help guide at the link below.
http://help.tradestation.com/10_00/eng/tradestationhelp/study/customize_study_alerts.htm
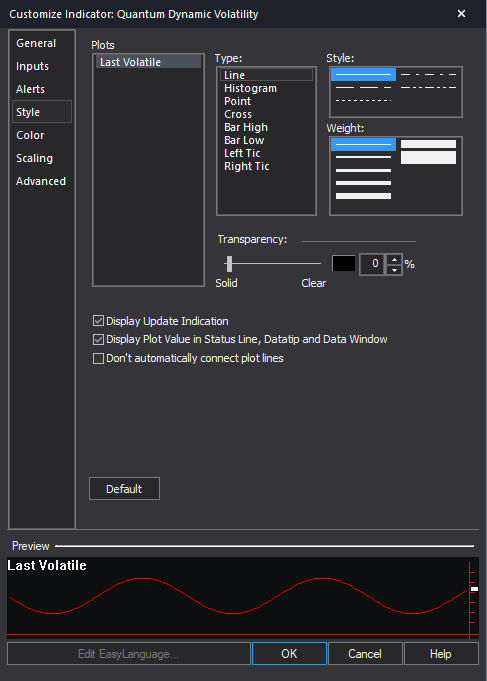
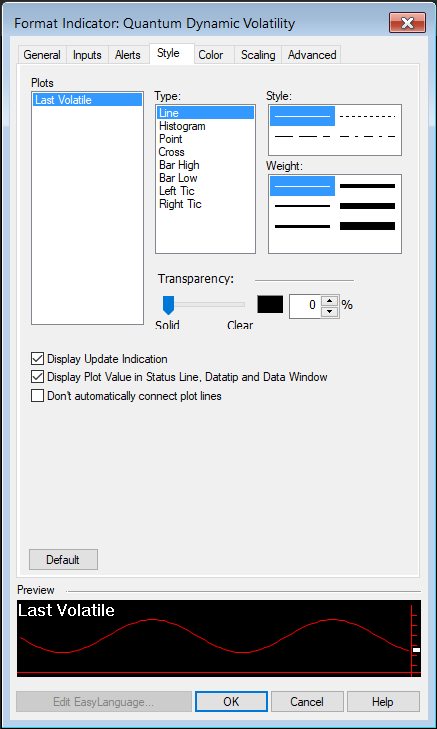
Style
We do not recommend changing the settings in this section. Please use the the ArrowSize and ArrowOffset variables in the indicator’s Inputs to safely change the size and position of the arrows.
You can learn more about the different options in the Style tab in TradeStation’s help guide at the link below.
http://help.tradestation.com/10_00/eng/tradestationhelp/study/customize_study_style.htm
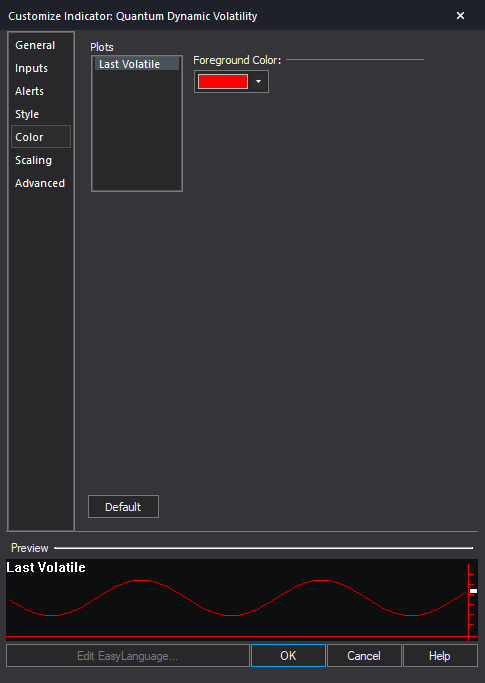
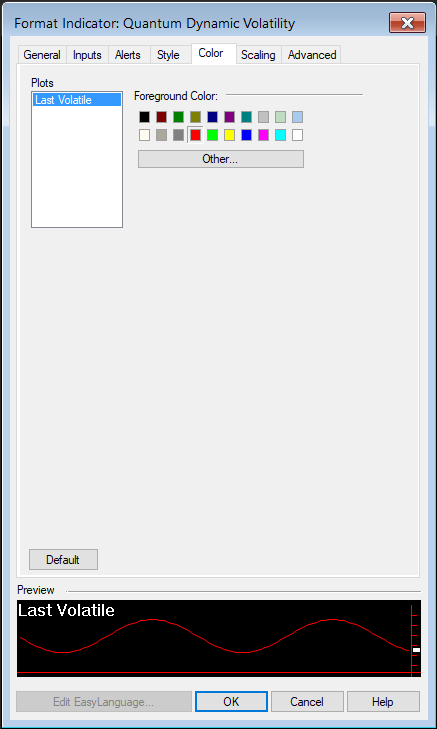
Color
We do not recommend changing the colors of the indicator in this section. Instead, please use the ArrowColor input (in the indicator’s Inputs) to safely change the color of the arrows.
You can learn more about the different options in the Color tab in TradeStation’s help guide at the link below.
http://help.tradestation.com/10_00/eng/tradestationhelp/study/customize_study_color.htm
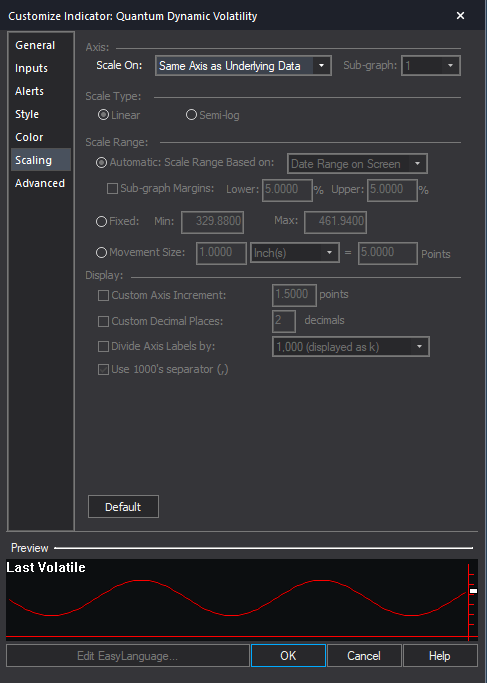
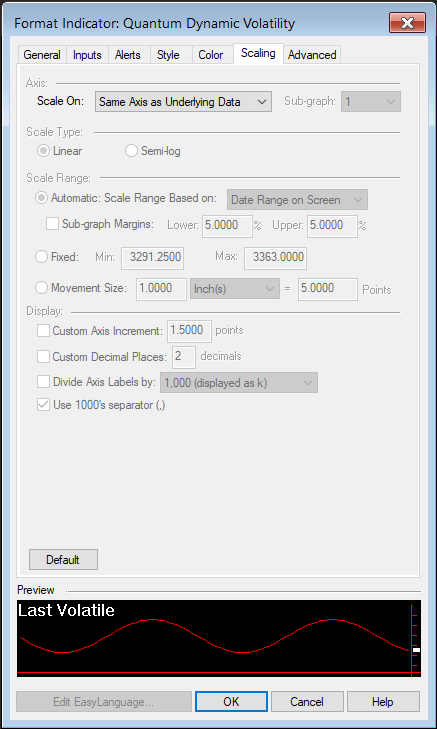
Scaling
The Scaling tab is used to modify the scaling settings for the y-axis of the indicator in the active Chart Analysis window. We do not recommend changing any of the settings in this section but you can learn more about the different options in the Scaling tab in TradeStation’s help guide at the link below.
http://help.tradestation.com/10_00/eng/tradestationhelp/study/customize_study_scaling.htm
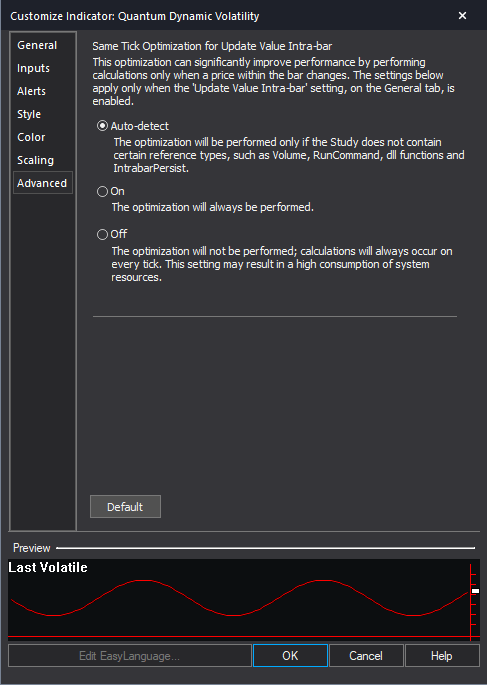
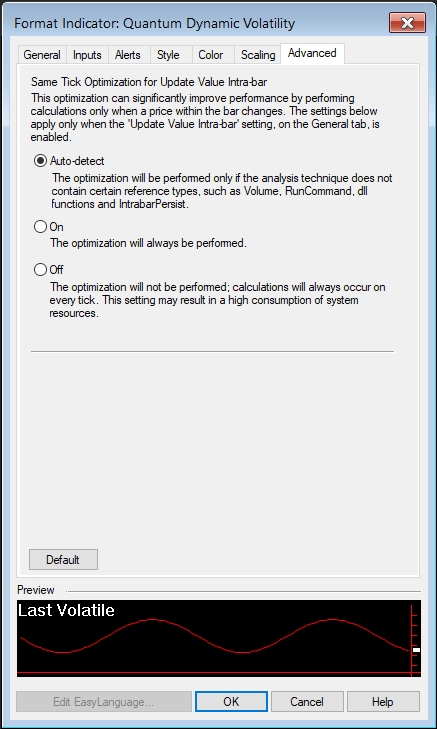
Advanced
The Advanced tab allows you to set advanced preferences for the indicator. We do not recommend changing any of the settings in this section but you can learn more about the different options in the Advanced tab in TradeStation’s help guide at the link below.
http://help.tradestation.com/10_00/eng/tradestationhelp/study/customize_study_advanced.htm
Removing the indicator from the Chart Analysis window
From the Chart Analysis window’s toolbar, please click Studies > Edit Studies…
In the Studies tab, select Quantum Dynamic Volatility and click Remove then click Close.
Applying the indicator to RadarScreen
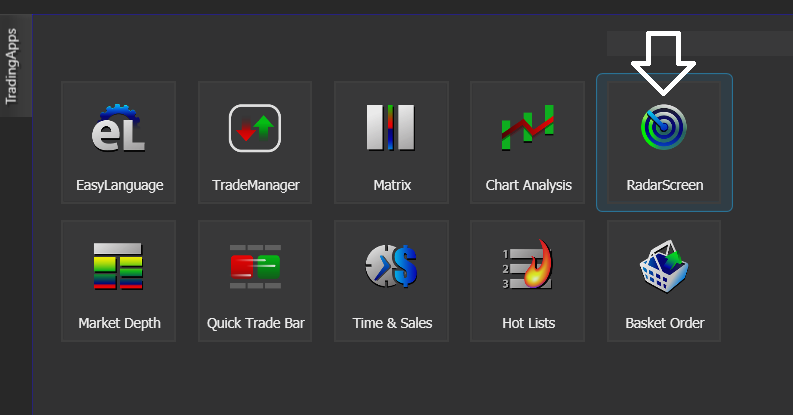
From the Apps menu of your TradeStation platform, please open a RadarScreen window.
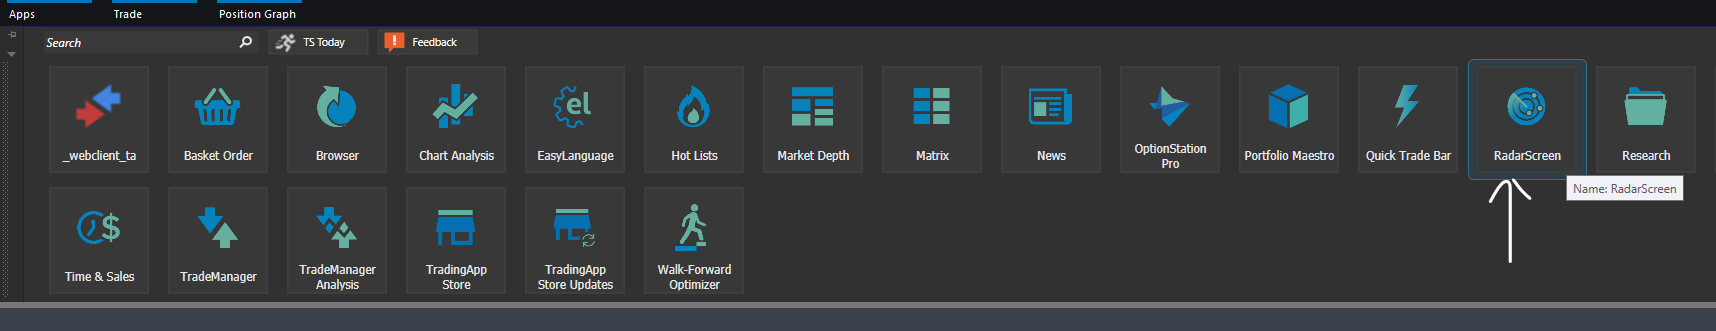
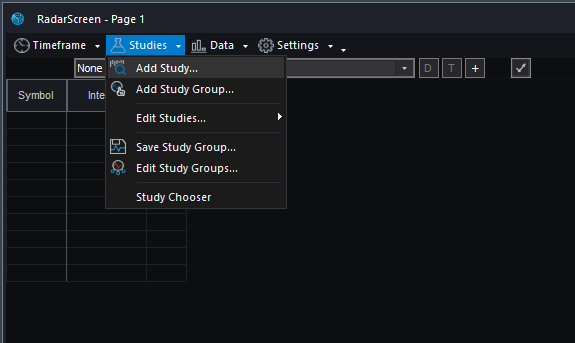
From the RadarScreen window’s toolbar, please click Studies > Add Study…
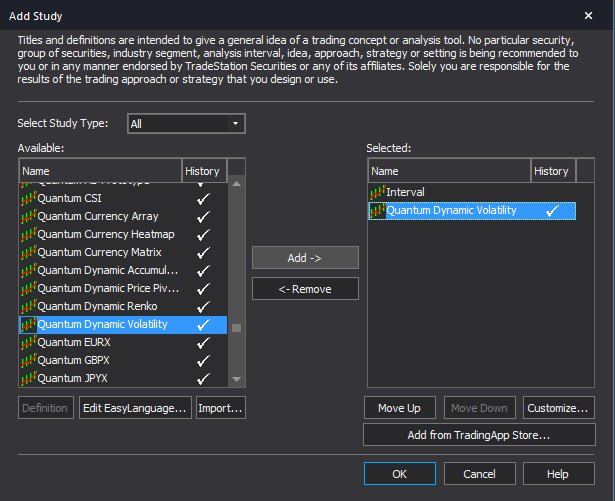
From the Add Study window, please choose Indicator at the left hand side of the interface then at the right, scroll down and select Quantum Dynamic Volatility. Click OK to apply the indicator to the chart.
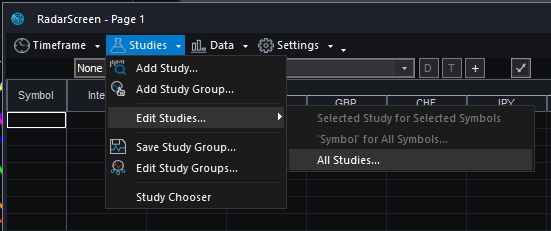
IMPORTANT: If this is your first time to run Quantum Trading indicators, the indicator will not work until you input your email address in its settings. To do this, please go back to your RadarScreen window and click Studies > Edit Studies… > All Studies…
Double-click the Quantum Dynamic Volatility to open the Customize Indicator window. In the Inputs section, find the MyQuantumTradingEmail input and enter here the email address you used at the Quantum Trading Shop to activate the indicator. PLEASE MAKE SURE TO ENCLOSE THE EMAIL ADDRESS IN DOUBLE QUOTATION MARKS. (example: “myemailaddress@gmail.com”)
Click OK (and Close) to save and go back to RadarScreen. Please note that you need to do this only once which means you do not need to input your email address again when running Quantum Trading indicators next time.
Compatible symbols in RadarScreen
The Quantum Dynamic Volatility indicator works with any symbol.
RadarScreen column
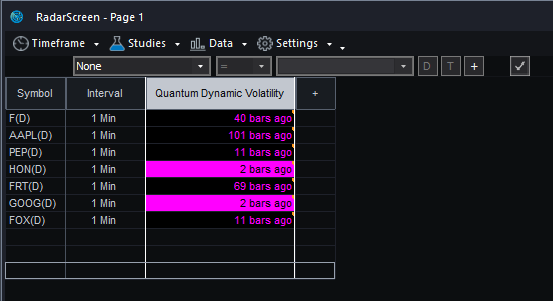
The Dynamic Volatility indicator only has 1 column when applied to RadarScreen and it displays how far in the bar history the last volatile bar was detected.
Color changes in the RadarScreen
The cell’s background and text color may change on certain conditions.
Background color changes
It turns magenta when the last volatile bar is recent.
Removing the indicator from RadarScreen
From the RadarScreen window’s toolbar, please click Studies > Edit Study… > All Studies… then select/click Quantum Dynamic Volatility in the list at right hand side of the window. Click the “<- Remove” button then click OK to close the window.
Using the indicator in TradeStation Global
Applying the indicator to a Chart Analysis window
From the Apps menu of your TradeStation platform, please open a Chart Analysis window.
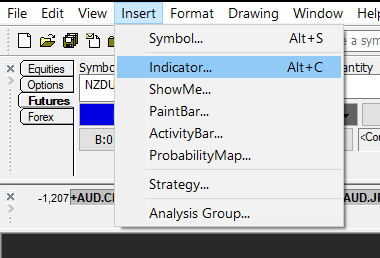
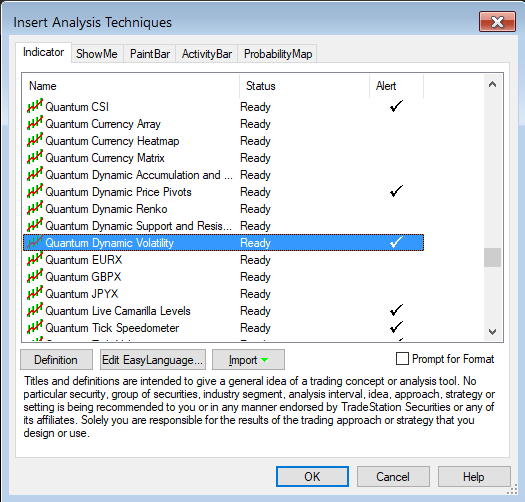
From the menu bar, click Insert > Indicator… > Indicator tab then scroll down at the list and select the Quantum Dynamic Volatility and click OK to apply the indicator in the chart.
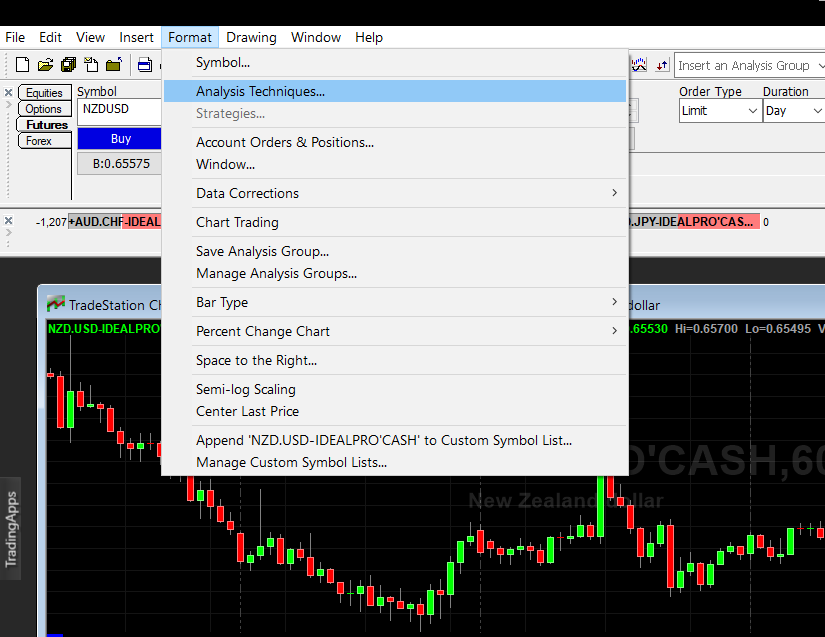
IMPORTANT: If this is your first time to run Quantum Trading indicators, the indicator will not work until you input your email address in its settings. To do this, please go back to your Chart Analysis window then in the menu bar, click Format > Analysis Techniques…
Select the indicator from the list then turn it On by clicking the Status button at the right hand side of the window. Click Format… or double-click the Quantum Dynamic Volatility to open the Format Indicator window. In the Inputs section, find the MyQuantumTradingEmail input and enter here the email address you used at the Quantum Trading Shop to activate the indicator. PLEASE MAKE SURE TO ENCLOSE THE EMAIL ADDRESS IN DOUBLE QUOTATION MARKS. (example: “myemailaddress@gmail.com”)
Click OK (and Close) to save and go back to your chart. Please note that you need to do this only once which means you do not need to input your email address again when running Quantum Trading indicators next time.
Customizing the indicator in Chart Analysis
Inputs
- MyQuantumTradingEmail – When running the indicator for the first time in your TradeStation trading account, you need to enter the email address you used to purchase the indicator in the Quantum Trading Shop as part of its verification process. You need to do this only once as the indicators “remember” your email address by storing it in the local drive. Please make sure that you enter your email address correctly and exactly without any extra spaces before and after it. If you made an error, simply fill this input again to update it. This is a string input which requires you to enclose your email address in double quotation marks (“”).
- Sensitivity – Increasing the value of this input by increments of 1 allows the indicator to become more sensitive to bars that exhibit volatility.
- ArrowOffset – You can add space between the arrow plots and the candlestick by increasing value of this input.
- ArrowSize – This input controls the size of the arrows.
- ArrowColor – This input defines the color of the arrows. As a string input, you need to enclose the name color in double quotation marks (“”). Named colors are the only accepted values in these inputs which are all listed in the following link – http://help.tradestation.com/09_01/tsdevhelp/Subsystems/elobject/class_win/color_class.htm. The color of a line reverts to the default named color if the input’s value is invalid.
General
You can modify the name, short name, notes, maximum number of bars the indicator will reference, and more. We do not recommend changing any of the settings in this section but you can learn more about the different options in the General tab in TradeStation’s help guide at the link below.
Alerts
This section controls the alert functions of the indicator. Alerts trigger every time a signal (either an upward or downward arrow) is detected.
You can learn more about the different options in the Alerts tab in TradeStation’s help guide at the link below.
Style
We do not recommend changing the settings in this section. Please use the the ArrowSize and ArrowOffset variables in the indicator’s Inputs to safely change the size and position of the arrows.
You can learn more about the different options in the Style tab in TradeStation’s help guide at the link below.
Color
We do not recommend changing the colors of the indicator in this section. Instead, please use the ArrowColor input (in the indicator’s Inputs) to safely change the color of the arrows.
You can learn more about the different options in the Color tab in TradeStation’s help guide at the link below.
Scaling
The Scaling tab is used to modify the scaling settings for the y-axis of the indicator in the active Chart Analysis window. We do not recommend changing any of the settings in this section but you can learn more about the different options in the Scaling tab in TradeStation’s help guide at the link below.
Advanced
The Advanced tab allows you to set advanced preferences for the indicator. We do not recommend changing any of the settings in this section but you can learn more about the different options in the Advanced tab in TradeStation’s help guide at the link below.
Removing the indicator from the Chart Analysis window
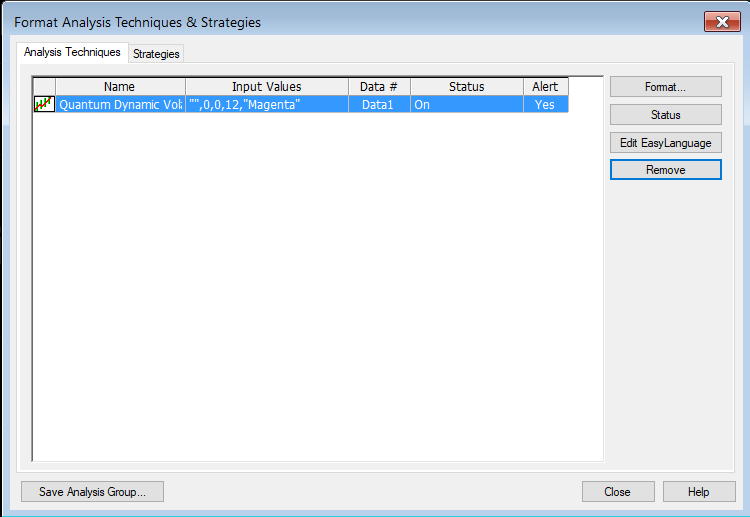
From the menu bar of your TradeStation platform, click Format > Analysis Techniques…
In the Analysis Techniques tab, select Quantum Dynamic Volatility and click Remove then click Close.
Applying the indicator to RadarScreen
From the Apps menu of your TradeStation platform, please open a RadarScreen window.
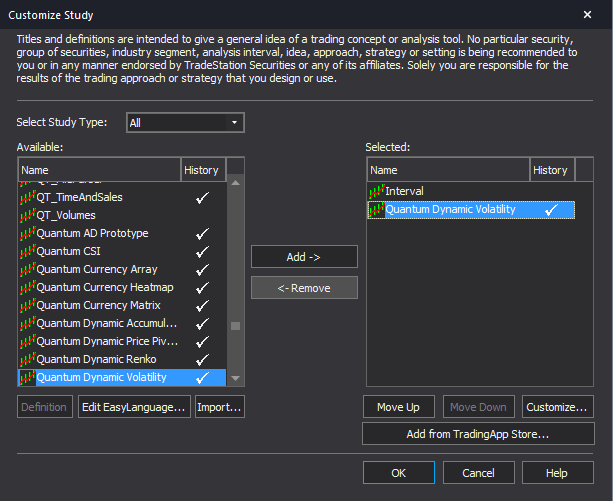
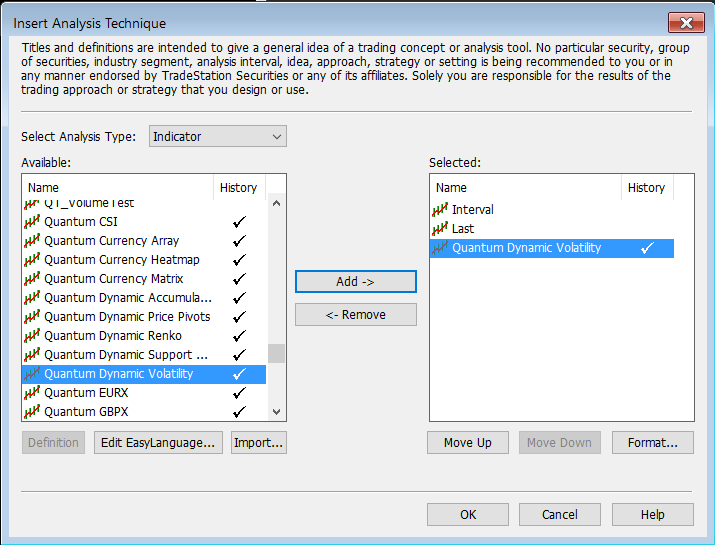
From the menu bar, click Insert > Indicator… > Indicator tab then scroll down at the indicators list at the left hand side and select the Quantum Dynamic Volatility. Click the Add -> button to apply the indicator in the RadarScreen. You can change the order of the indicators by clicking the Move up and Move down buttons while the indicator is selected in the list at the right hand side.
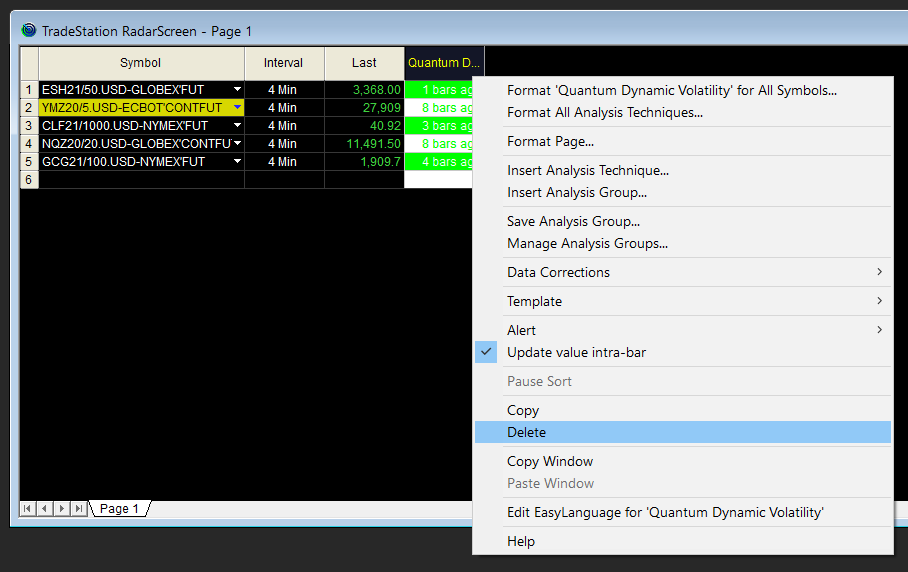
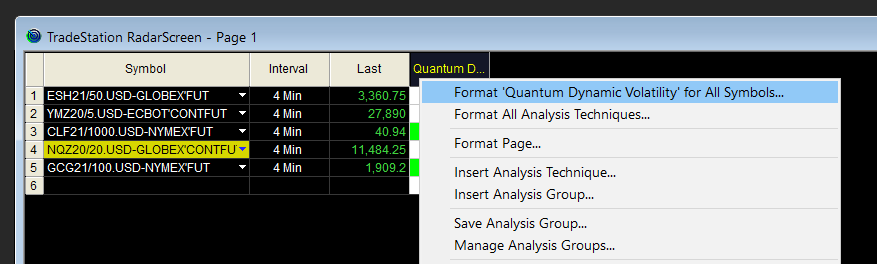
IMPORTANT: If this is your first time to run Quantum Trading indicators, the indicator will not work until you input your email address in its settings. To do this, please go back to your RadarScreen window and right-click the Quantum Dynamic Volatility’s column header then select Format ‘Quantum Dynamic Volatility’ for all Symbols…
In the Inputs tab, find the MyQuantumTradingEmail input and enter here the email address you used at the Quantum Trading Shop to activate the indicator. PLEASE MAKE SURE TO ENCLOSE THE EMAIL ADDRESS IN DOUBLE QUOTATION MARKS. (example: “myemailaddress@gmail.com”)
Click OK to save and go back to RadarScreen. Please note that you need to do this only once which means you do not need to input your email address again when running Quantum Trading indicators next time.
Compatible symbols in RadarScreen
The Quantum Dynamic Volatility indicator works with any symbol.
RadarScreen columns
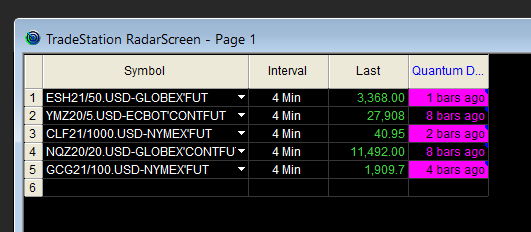
The Dynamic Volatility indicator only has 1 column when applied to RadarScreen and it displays how far in the bar history the last volatile bar was detected.
Color changes in the RadarScreen
The cell’s background and text color may change on certain conditions.
Background color changes
It turns magenta when the last volatile bar is recent.
Removing the indicator from RadarScreen
From the RadarScreen window, right-click the Quantum Dynamic Volatility’s column header then select Delete.