Overview of The Dynamic Renko Indicator
If you have been trading for a good amount of time, then you might have already heard of the word “renko” or have seen it in trading forums and passed around trader discussions and communities. It refers to a Japanese charting technique that is popular among traders because of its special way of plotting bars. It removes “time” in the equation and focuses on price action effectively baring the true direction of the market without the noise that you would normally see in a normal time-based chart.
Here’s how: a bar us created when the price exceeds the previous bar’s high or low by a predefined amount or what we call the box size or brick size. This gives the renko chart a pleasant quality of having equally sized bars that are running up or down in 45-degree angles. This offers the trader some advantages.
First, it allows traders to focus solely on price as the chart filters out all minor price fluctuations and market “noise”. This makes it easier for traders not only to identify strong moves but also to spot significant turning points, and so allow traders to deploy smarter entries and exits.
Second, a renko chart then helps traders in what is probably one of the most difficult aspects of trading, namely staying in a position once a move is underway. The renko chart does this by displaying price momentum as it speeds up and slows down and it does this because a renko chart is devoid of time.
Finally, because the bricks are drawn at 45-degree angles from each other, the charts are easier to read and to analyze.
Unfortunately, the renko chart type is not always available in trading platforms and the Quantum Dynamic Renko indicator solves just that with some exciting features.
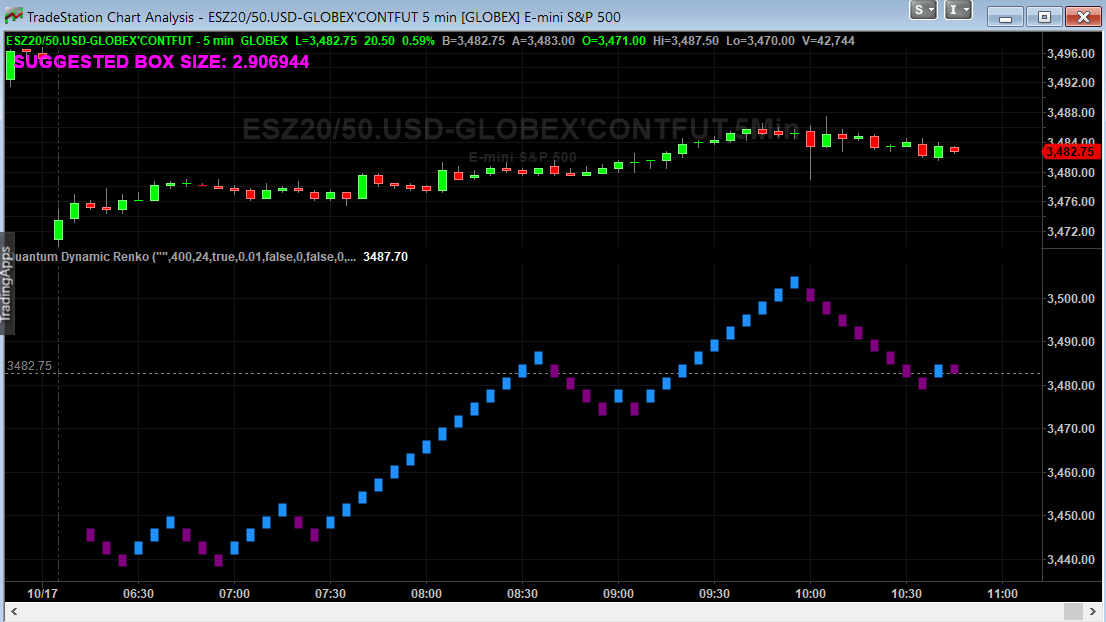
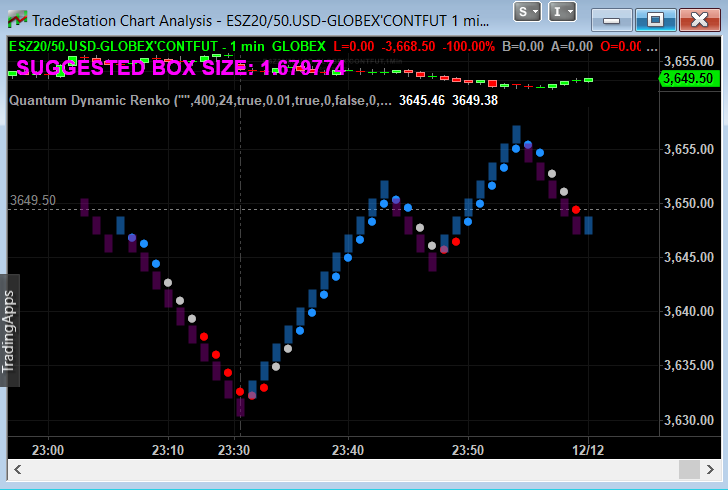
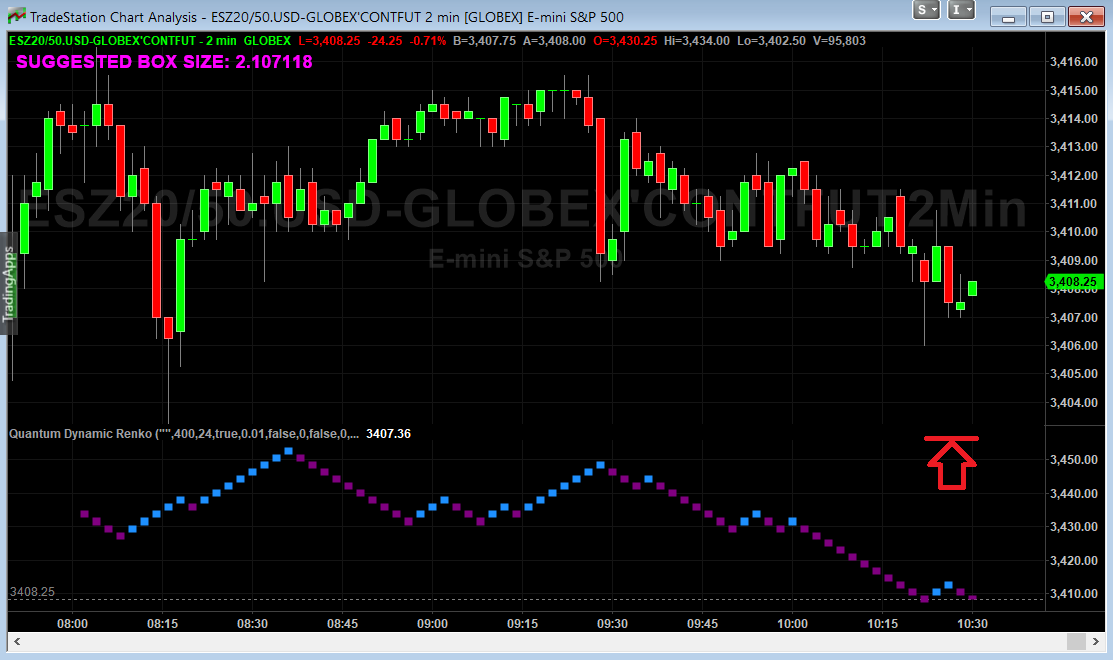
When applied, the Dynamic Renko indicator is nestled below the main chart and creates a renko chart representation of the time-based chart above. Please note that since renko charts are devoid of time so the time x-axis of the chart does not apply to the renko chart displayed. Right off the bat, the Dynamic Renko indicator takes the time-based chart above and calculates the best box size that matches the current timeframe then uses it to create the renko bars below. The computed box size is displayed at the top left-hand side of the chart in clear bold letters.
Dual Mode
The Quantum Dynamic Renko indicator for TradeStation features two modes:
- Compute Best Box Size
- Fixed Box Size
Compute Best Box Size
Using the indicator in this mode allows you to “convert” a normal candlestick chart to a renko bar chart by computing the best box size for a particular timeframe. This is computed by calculating the average true range (ATR) of the current symbol within a given period on a specific timeframe. This is displayed in the top left-hand side of the chart.
Fixed Box Size
Using the indicator in this mode allows you to set a constant box size for generating renko bars. The box size can accept floating point numbers.
Integrated Quantum Trading indicators.
The Quantum Dynamic Renko indicator for TradeStation includes the sought-after trend indicators of Quantum Trading:
- Quantum Trends indicator
- Quantum Trend Monitor indicator (lite version)
Quantum Trend Monitor indicator (lite)
The Quantum Trend Monitor has been designed to absorb temporary pauses and pullbacks. It analyses the price action, and only changes to a transitional color of dark red or dark blue, if the trend is showing a temporary sign of weakness. If it is a true change in trend direction, the indicator will change to a bright color, as the new trend develops.
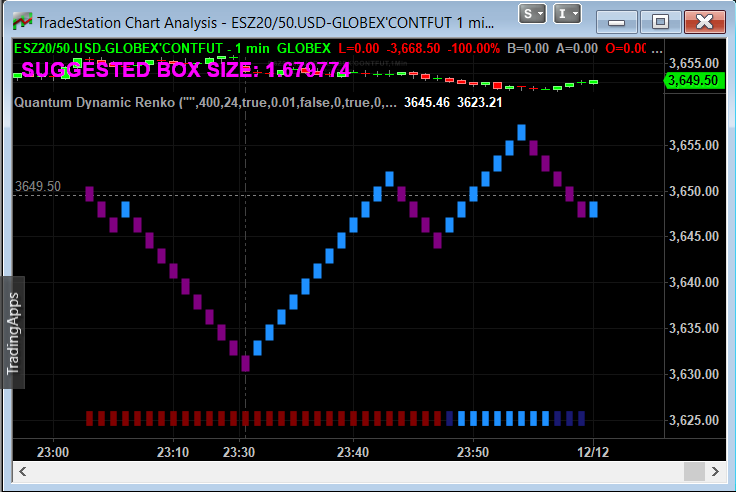
The Quantum Trend Monitor displays four colours at the bottom of the screen as a solid bar:
- Bright blue – strongly bullish trend
- Bright red – strongly bearish trend
- Dark blue – weakness in bullish trend
- Dark red – weakness in bearish trend
(Please note that this version of the Trend Monitor does not include the yellow trend line mode.)
First, the Quantum Trends indicator alerts you to a possible new trend. If the trend is strong, the Quantum Trend Monitor will change to either bright blue or bright red, supporting the Trends indicator as the trend develops.
Quantum Trends indicator
The Quantum Trends indicator is the ‘sister’ indicator to the Quantum Trend Monitor. Together they go hand in hand to keep you in and surfing the trend. The Quantum Trends catches the shorter term trend, and then the Quantum Trend Monitor keeps you in for the longer term.
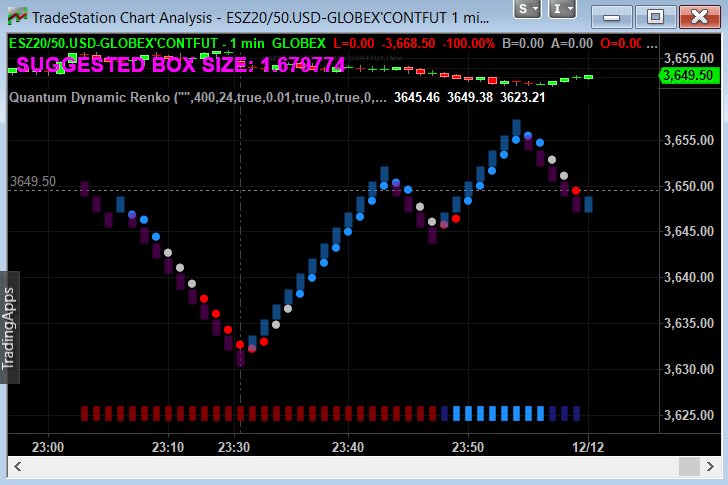
The Quantum Trends indicator paints a series of dots on the price chart as follows:
- Bullish trend – blue
- Bearish trend – red
- Congestion – grey
Once a new trend starts, the dots change colour dynamically, from blue to red or grey.
The Quantum Trends create the signal, its sister indicator the Quantum Trend Monitor then kicks in. Together, these two indicators provide you with the perfect tools to manage your position.
The Quantum Dynamic Renko indicator is here to fill your need for one of the most useful charting techniques right from your own TradeStation platform. Get this indicator today and open up a new door full of opportunities through the wonders of renko chart trading.
Using the indicator in TradeStation 9.5
Applying the indicator to a Chart Analysis window
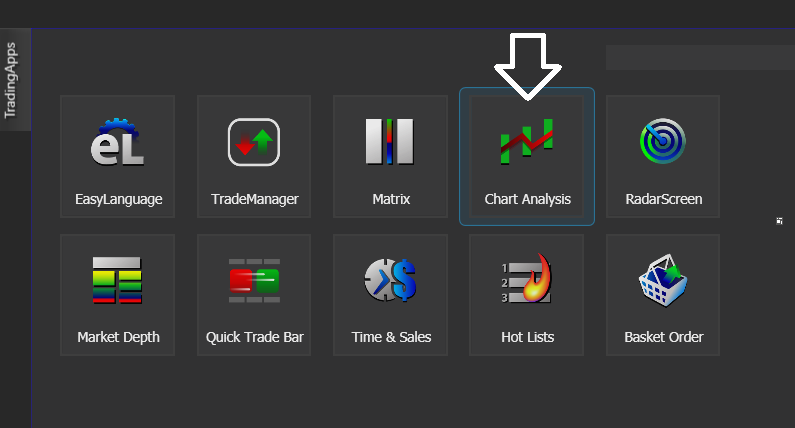
From the Apps menu of your TradeStation platform, please open a Chart Analysis window.
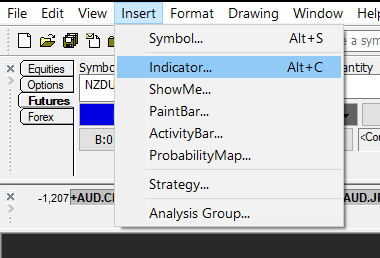
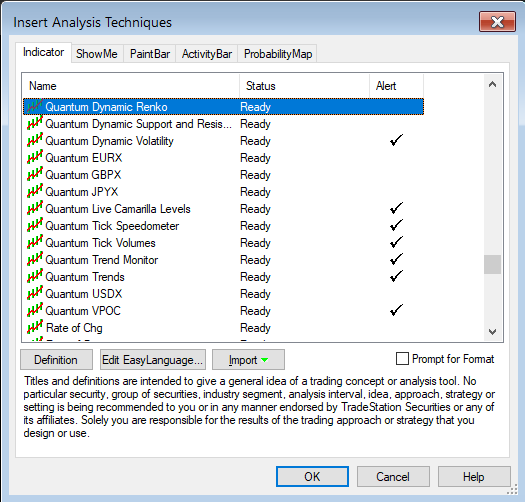
From the menu bar, click Insert > Indicator… > Indicator tab then scroll down at the list and select the Quantum Dynamic Renko and click OK to apply the indicator in the chart.
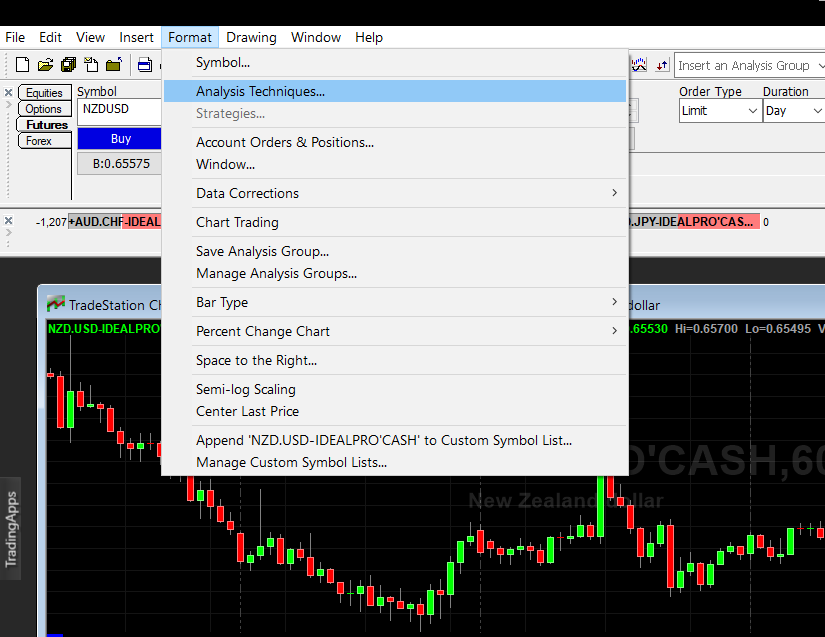
IMPORTANT: If this is your first time to run Quantum Trading indicators, the indicator will not work until you input your email address in its settings. To do this, please go back to your Chart Analysis window then in the menu bar, click Format > Analysis Techniques…
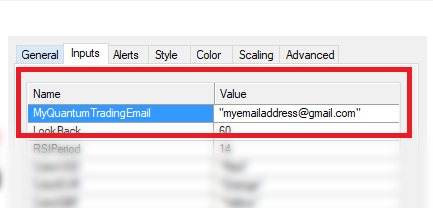
Select the indicator from the list then turn it On by clicking the Status button at the right hand side of the window. Click Format… or double-click the Quantum Dynamic Renko to open the Format Indicator window. In the Inputs section, find the MyQuantumTradingEmail input and enter here the email address you used at the Quantum Trading Shop to activate the indicator. PLEASE MAKE SURE TO ENCLOSE THE EMAIL ADDRESS IN DOUBLE QUOTATION MARKS. (example: “myemailaddress@gmail.com”)
Click OK (and Close) to save and go back to your chart. Please note that you need to do this only once which means you do not need to input your email address again when running Quantum Trading indicators next time.
Customizing the indicator in Chart Analysis
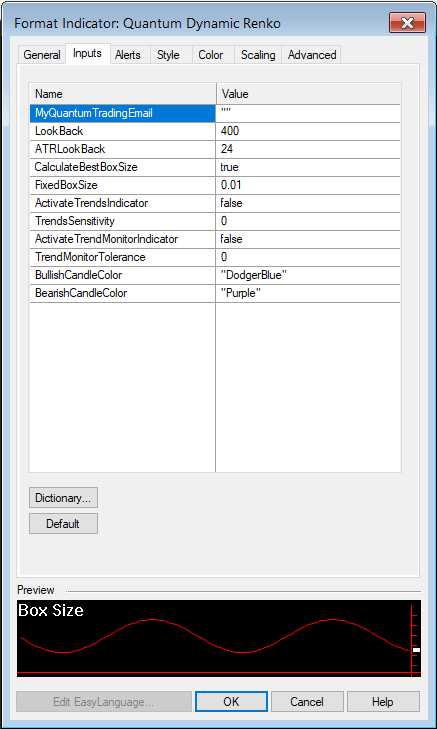
Inputs
- MyQuantumTradingEmail – When running the indicator for the first time in your TradeStation trading account, you need to enter the email address you used to purchase the indicator in the Quantum Trading Shop as part of its verification process. You need to do this only once as the indicators “remember” your email address by storing it in the local drive. Please make sure that you enter your email address correctly and exactly without any extra spaces before and after it. If you made an error, simply fill this input again to update it. This is a string input which requires you to enclose your email address in double quotation marks (“”).
- LookBack – This input determines how far back in the bar history the indicator should convert the chart into Renko bars. The default number of bars processed by the indicator is 400 bars.
- ATRLookBack – This input defines the length of the ATR function that is used to calculate the optimal box size from the current chart.
- CalculateBestBoxSize – Setting this input to true tells the indicator to compute the best Renko box size based on the current chart. If its value is false, the indicator uses the box size specified in the FixedBoxSize input to create the Renko chart.
- FixedBoxSize – This input is the box size used by the indicator when CalculateBestBoxSize input is set to false. The user can specify his own box size instead of a calculated one using this input.
- ActivateTrendsIndicator – This input enables or disables the internal Trends indicator. Set this input to true to display the Trends indicator in the Renko chart.
- TrendsSensitivity – This input has been provided to allow you to fine-tune the internal Trends indicator to your own trading style and attitude to risk. Increasing its value makes the indicator more sensitive to detecting congestion phases of price action. This means you will see more of the grey dots which are early signs of potential weakness in the respective trends.
- ActivateTrendMonitorIndicator – This input enables or disables the internal Trend Monitor indicator. Set this input to true to display the Trend Monitor indicator in the Renko chart.
- TrendMonitorTolerance – This input controls the internal Trend Monitor indicator’s tolerance to sudden trend changes. It is a factor used by the indicator to smooth out the noise in the chart’s price action. As you increase its value, easing in and out of stronger trends become more apparent.
- BullishCandleColor – This setting allows you to change the color of the bullish Renko bricks. As a string input, you need to enclose the name color in double quotation marks (“”). Named colors are the only accepted values in these inputs which are all listed in the following link – http://help.tradestation.com/09_01/tsdevhelp/Subsystems/elobject/class_win/color_class.htm. The color of a line reverts to the default named color if the input’s value is invalid.
- BearishCandleColor – This setting allows you to change the color of the bearish Renko bricks. As a string input, you need to enclose the name color in double quotation marks (“”). Named colors are the only accepted values in these inputs which are all listed in the following link – http://help.tradestation.com/09_01/tsdevhelp/Subsystems/elobject/class_win/color_class.htm. The color of a line reverts to the default named color if the input’s value is invalid.
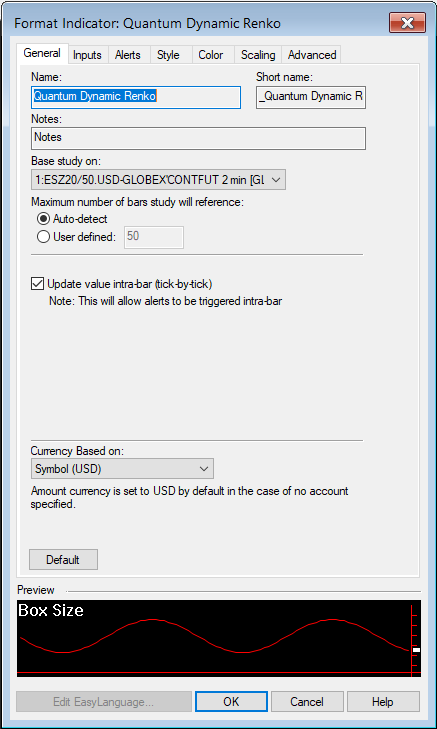
General
You can modify the name, short name, notes, maximum number of bars the indicator will reference, and more. We do not recommend changing any of the settings in this section but you can learn more about the different options in the General tab in TradeStation’s help guide at the link below.
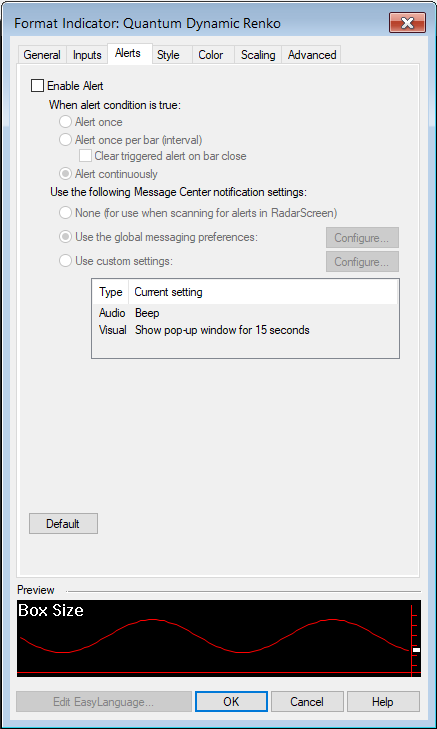
Alerts
The Quantum Dynamic Renko indicator does not have alert functions.
You can learn more about the different options in the Alerts tab in TradeStation’s help guide at the link below.
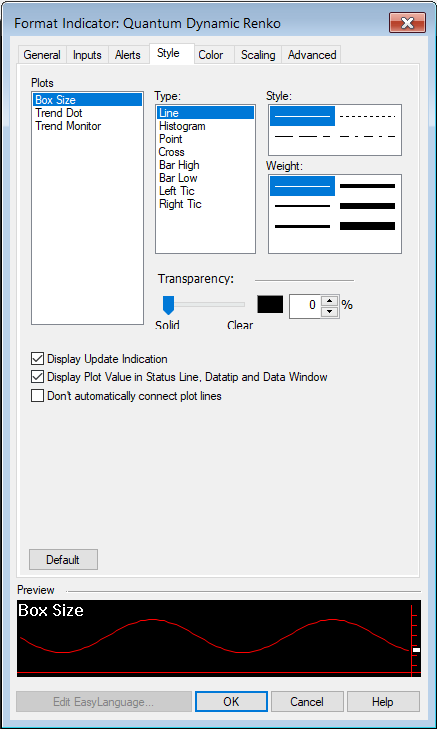
Style
The plots in this section are not used when the indicator is running in a Chart Analysis window thus changing the properties of these plots have no effect in its appearance. We do not recommend changing the settings in this section.
You can learn more about the different options in the Style tab in TradeStation’s help guide at the link below.
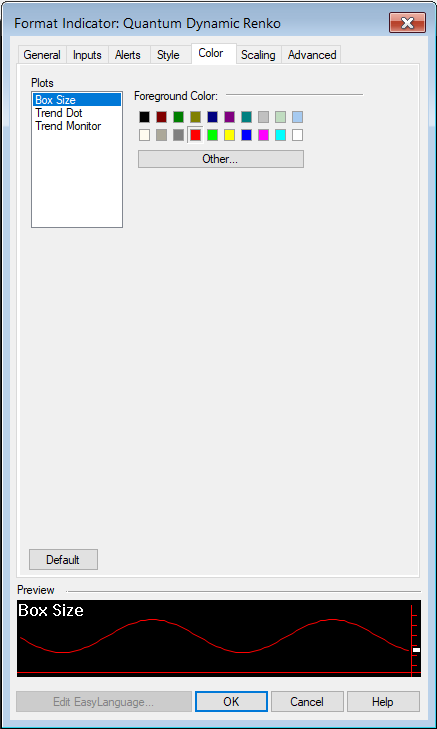
Color
Please use the BullishCandleColor and BearishCandleColor inputs to change the color of the renko bricks. Changing the settings in this section has no effect in the appearance of the indicator in a Chart Analysis window.
You can learn more about the different options in the Color tab in TradeStation’s help guide at the link below.
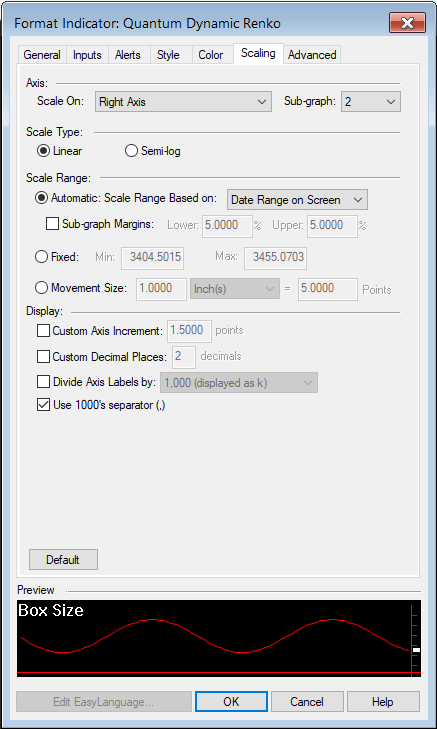
Scaling
he Scaling tab is used to modify the scaling settings for the y-axis of the indicator in the active Chart Analysis window. We do not recommend changing any of the settings in this section but you can learn more about the different options in the Scaling tab in TradeStation’s help guide at the link below.
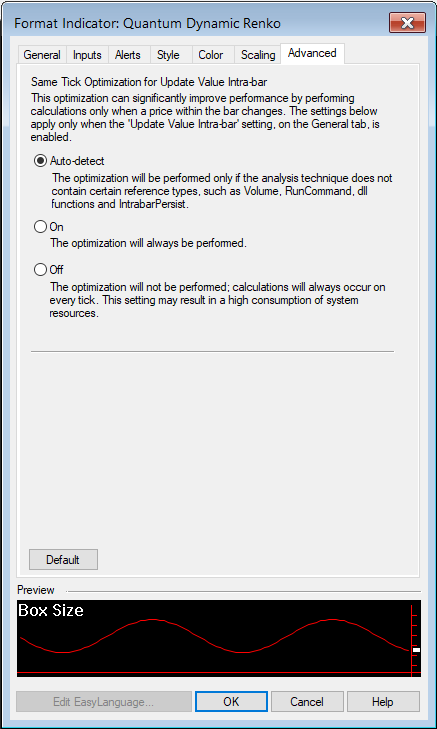
Advanced
The Advanced tab allows you to set advanced preferences for the indicator. We do not recommend changing any of the settings in this section but you can learn more about the different options in the Advanced tab in TradeStation’s help guide at the link below.
Expanding the Indicator’s Screen Size
Follow the steps below to expand the Quantum Dynamic Renko’s screen size in the chart.
- Hover your mouse pointer over the space between the Quantum Dynamic Renko and the chart above it until the mouse cursor changes into a double headed arrow
- HOLD down the left click on your mouse, and drag the mouse to the top until all currency buttons are visible
- Hover your mouse over the right hand edge of the chart until a double headed arrow appears
- HOLD down the left click on your mouse, and drag the right hand edge of the chart across to the left and release when done
- Click on the chart to make it the active window
- Click on the Increase Bar Spacing icon in the toolbar, to expand the indicator to full size.
Removing the indicator from the Chart Analysis window
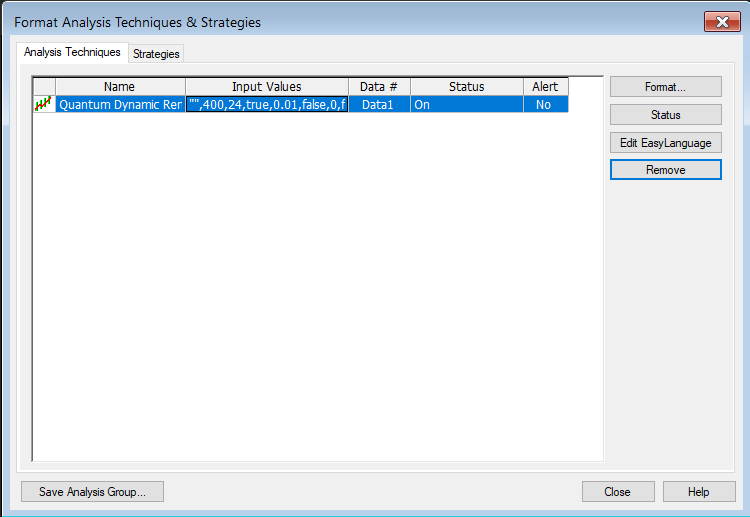
From the menu bar of your TradeStation platform, click Format > Analysis Techniques…
In the Analysis Techniques tab, select Quantum Dynamic Renko and click Remove then click Close.
Applying the indicator to RadarScreen
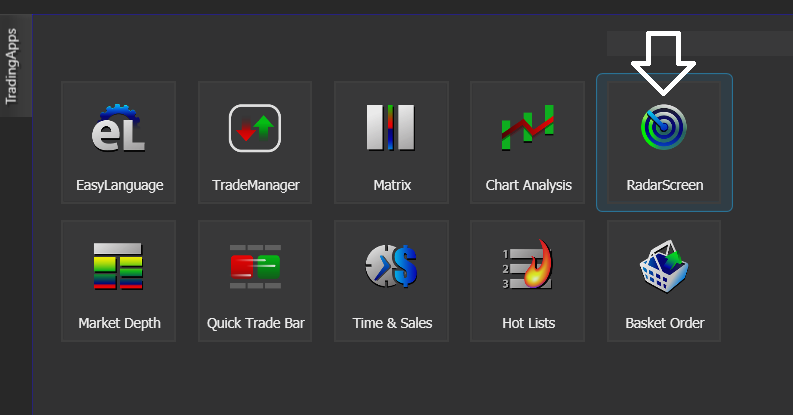
From the Apps menu of your TradeStation platform, please open a RadarScreen window.
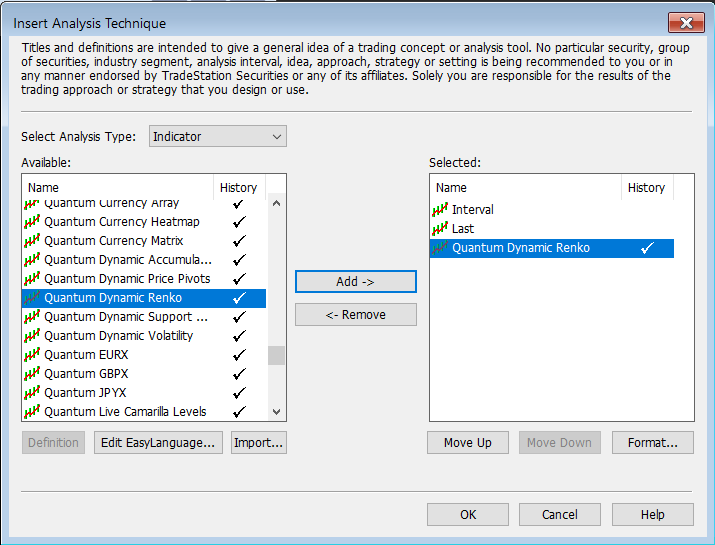
From the menu bar, click Insert > Indicator… > Indicator tab then scroll down at the indicators list at the left hand side and select the Quantum Dynamic Renko. Click the Add -> button to apply the indicator in the RadarScreen. You can change the order of the indicators by clicking the Move up and Move down buttons while the indicator is selected in the list at the right hand side.
IMPORTANT: If this is your first time to run Quantum Trading indicators, the indicator will not work until you input your email address in its settings. To do this, please go back to your RadarScreen window and right-click the Quantum Dynamic Renko’s column header then select Format ‘Quantum Dynamic Renko’ for all Symbols…
In the Inputs tab, find the MyQuantumTradingEmail input and enter here the email address you used at the Quantum Trading Shop to activate the indicator. PLEASE MAKE SURE TO ENCLOSE THE EMAIL ADDRESS IN DOUBLE QUOTATION MARKS. (example: “myemailaddress@gmail.com”)
Click OK to save and go back to RadarScreen. Please note that you need to do this only once which means you do not need to input your email address again when running Quantum Trading indicators next time.
Compatible symbols in RadarScreen
The Quantum Dynamic Renko indicator works with any symbol.
RadarScreen columns
Box Size
This column displays the optimized box size calculated for the row’s current interval (timeframe) if CalculateBestBoxSize input is true otherwise, it displays the value of the FixedBoxSize input.
Trend Dot
Displays the current value and state of the internal Trends indicator when the ActivateTrendsIndicator input is true.
Trend Monitor
Displays the current state of the internal Trend Monitor indicator when the ActivateTrendMonitorIndicator input is true.
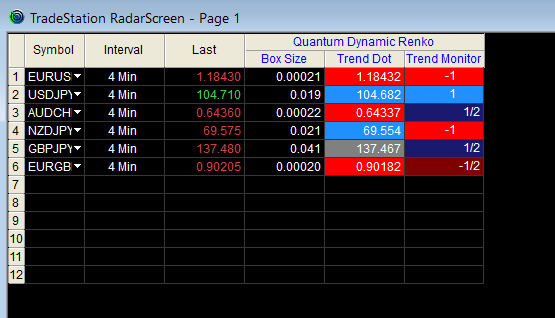
Color changes in the RadarScreen
The cell’s background and text color may change on certain conditions.
Background color changes
- The Trend Monitor column changes color depending on its current value. Please remember that the ActivateTrendMonitorIndicator input must be true to enable this column.
- Blue 1 – when the trend is bullish and strong
- Red 1 – when the trend is bearish and strong
- Dark blue ½ – when the trend is bullish but weak
- Dark red ½ – when the trend is bearish but weak
- The Trend Dot column changes color depending on the current trend. Please remember that the ActivateTrendsIndicator input must be true to enable this column.
- Red when the indicator is detecting a downtrend
- Blue when the indicator is detecting an uptrend
- White when the indicator is detecting ranging trend/congestion
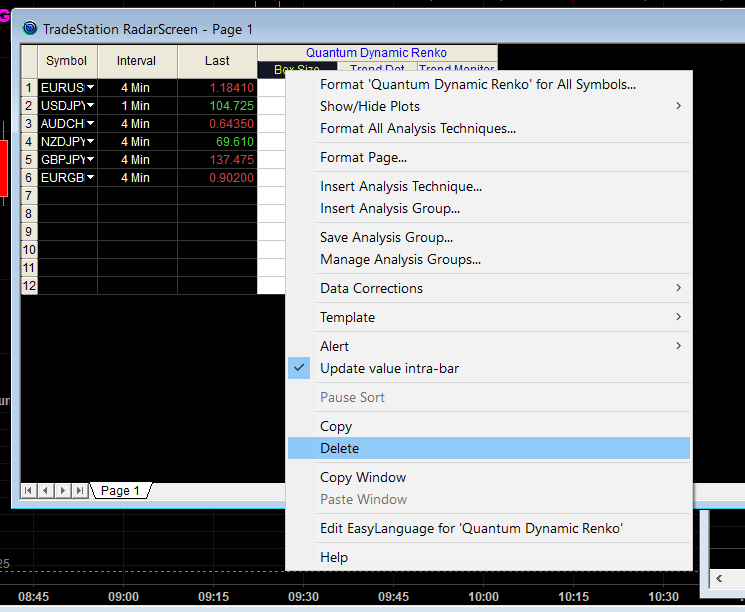
Removing the indicator from RadarScreen
From the RadarScreen window, right-click the Quantum Dynamic Renko’s column header then select Delete.