Overview Of The Tick Volumes Indicator
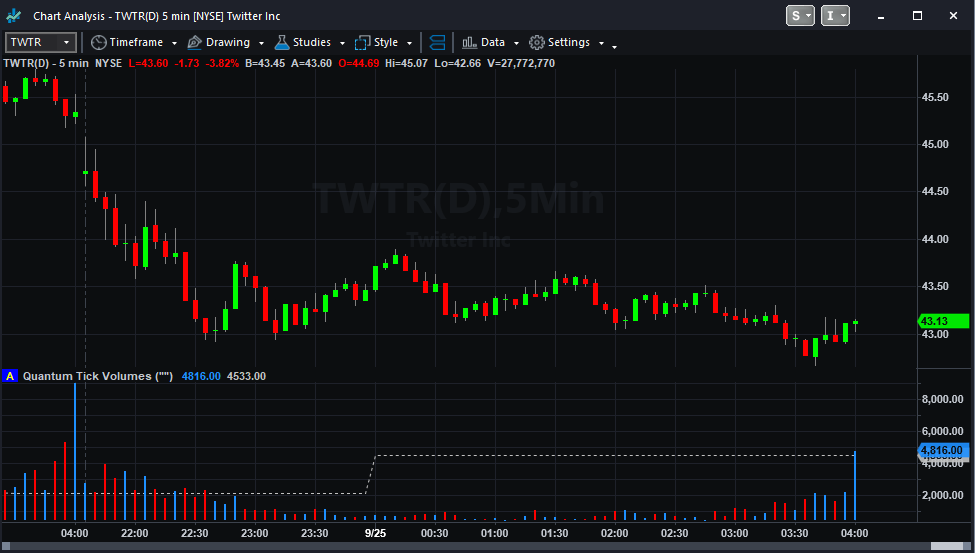
The Quantum Tick Volumes indicator has been designed to help you apply volume price analysis quickly and easily in all timeframes. The indicator takes the broker tick feed and paints the volume bar to match the price action. Where the price has closed higher, then the volume bar is painted blue, and where it has closed lower, then it is painted red. The indicator also displays a horizontal dotted line that marks half of the highest volume bar during each day. This helps to determine whether volume being displayed is very high, high, average or low, and to judge this against the price action accordingly.
- The Quantum Tick Volumes indicator works in all timeframes.
- For clarity, we find it is best applied to the bottom of the chart with the Quantum Trend Monitor immediately above
- Please note that the dotted line that represent half of the highest volume within the day is visible in charts below the Daily timeframe only.
Using the indicator in TradeStation Securities
Setting the volume data
The Tick Volumes indicator requires Tick Count data for forex and Trade Volume on any other symbol to operate. This must be configured in the Chart Analysis’s Data options before starting to use the indicator.
The Forex market measures volume by counting the tick movements. To use the indicator from such symbols, you need to choose Tick Count for its volume data otherwise no output will be generated. Here’s how to set Tick Count as your chart’s volume data: from the Chart Analysis window’s toolbar, please click Data > Edit Symbol… then select Settings section at the left hand side of the window. Find the drop down menu under the “For volume” label and select the value “Tick Count” from the options. Click OK to confirm and with this, you are now ready to use the Quantum Tick Volumes for forex.
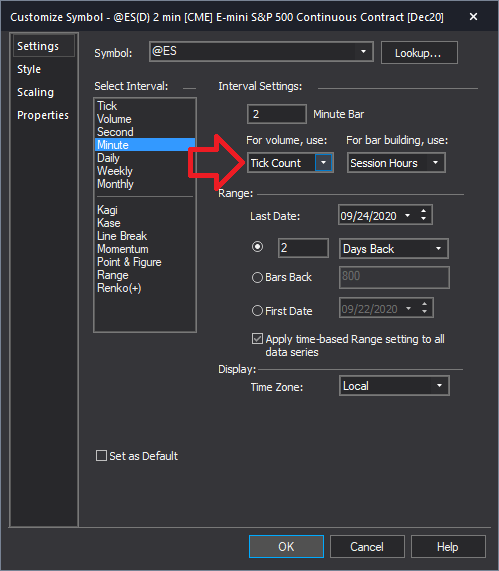
For other symbols, you may choose either Tick Count or Trade Vol from the options as source of your volume data.
Applying the indicator to a Chart Analysis window
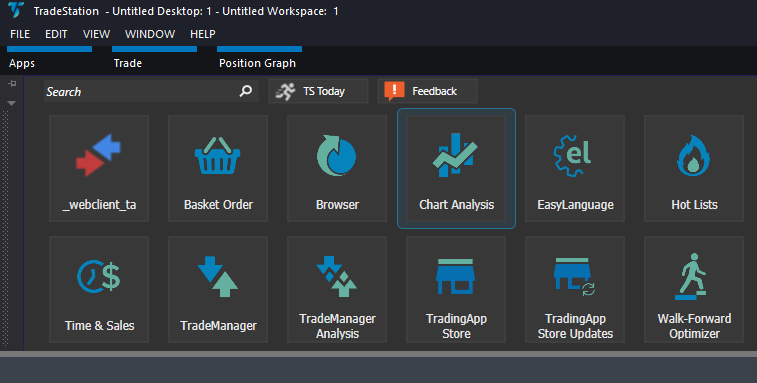
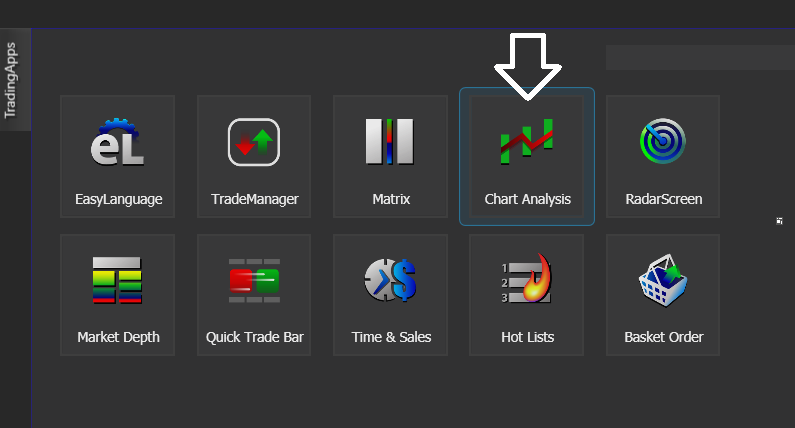
From the Apps menu of your TradeStation platform, please open a Chart Analysis window.
From the Chart Analysis window’s toolbar, please click Studies > Add Study…
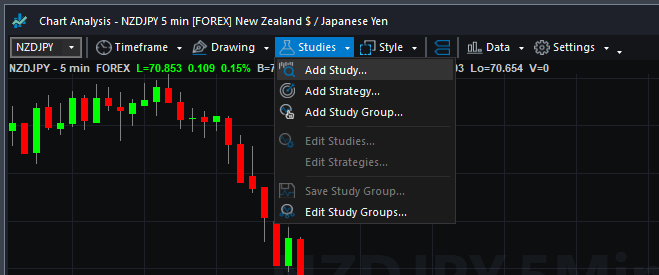
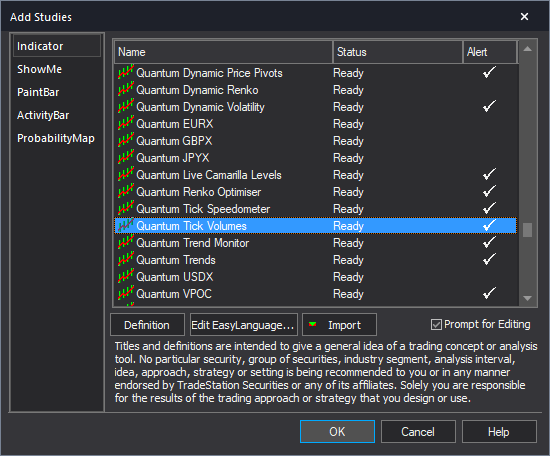
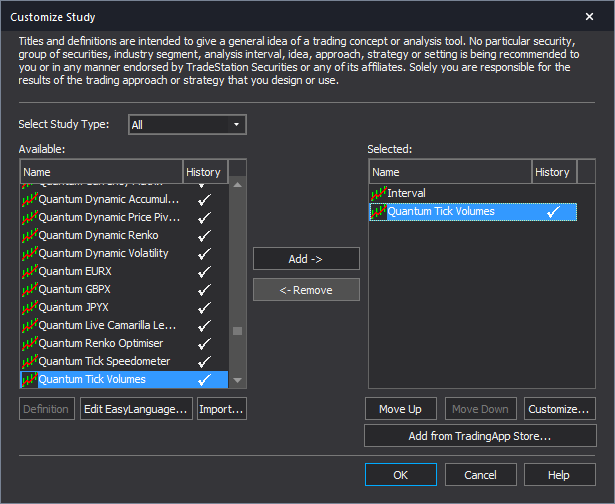
From the Add Study window, please choose Indicator at the left hand side of the interface then at the right, scroll down and select Quantum Tick Volumes. Click OK to apply the indicator to the chart.
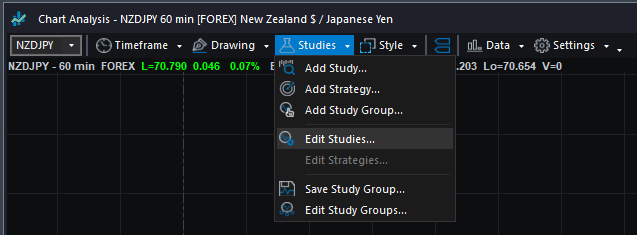
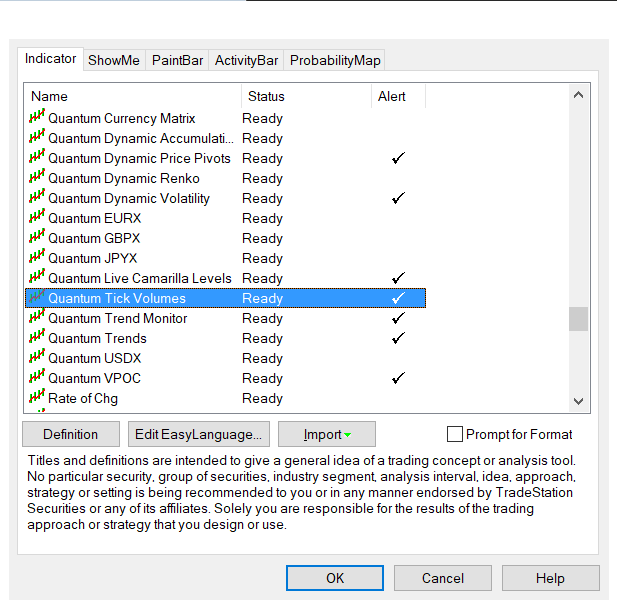
IMPORTANT: If this is your first time to run Quantum Trading indicators, the indicator will not work until you input your email address in its settings. To do this, please go back to your Chart Analysis window and click Studies > Edit Studies…
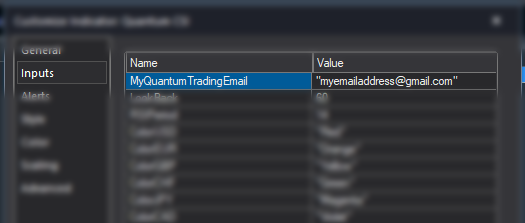
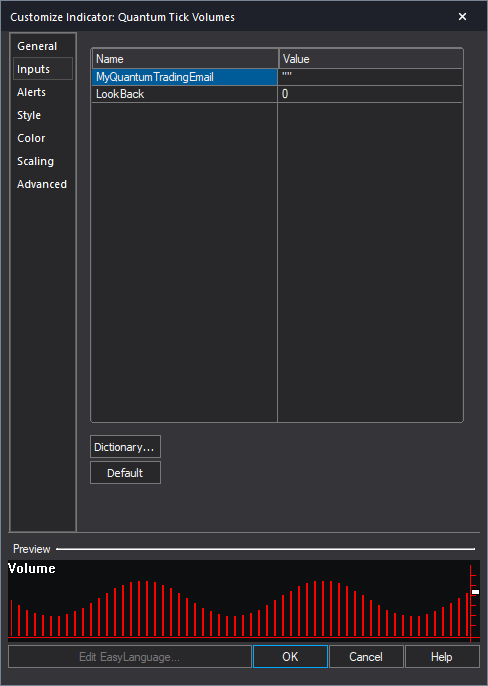
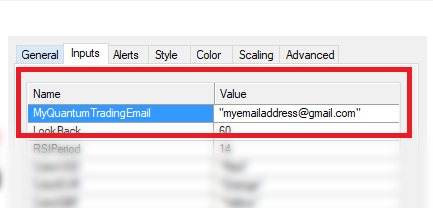
Select the indicator from the list then turn it On by clicking the Status button at the right hand side of the window. Click Customize… or double-click the Quantum Tick Volumes to open the Customize Indicator window. In the Inputs section, find the MyQuantumTradingEmail input and enter here the email address you used at the Quantum Trading Shop to activate the indicator. PLEASE MAKE SURE TO ENCLOSE THE EMAIL ADDRESS IN DOUBLE QUOTATION MARKS. (example: “myemailaddress@gmail.com”)
Click OK (and Close) to save and go back to your chart. Please note that you need to do this only once which means you do not need to input your email address again when running Quantum Trading indicators next time.
Customizing the indicator in Chart Analysis
Inputs
- MyQuantumTradingEmail – When running the indicator for the first time in your TradeStation trading account, you need to enter the email address you used to purchase the indicator in the Quantum Trading Shop as part of its verification process. You need to do this only once as the indicators “remember” your email address by storing it in the local drive. Please make sure that you enter your email address correctly and exactly without any extra spaces before and after it. If you made an error, simply fill this input again to update it. This is a string input which requires you to enclose your email address in double quotation marks (“”).
- LookBack – The Quantum Tick Volumes indicator includes a line that shows the user half of the day’s highest volume bar and because this is an intraday calculation, this is displayed in timeframes below Daily only. By adding a value greater than 0 to the LookBack input, the indicator shifts to a new mode where it calculates half of the highest volume bar within the LookBack period instead of the current day. In this mode, the middle volume line becomes visible in any timeframe and it allows you to analyze smaller segments of the chart.
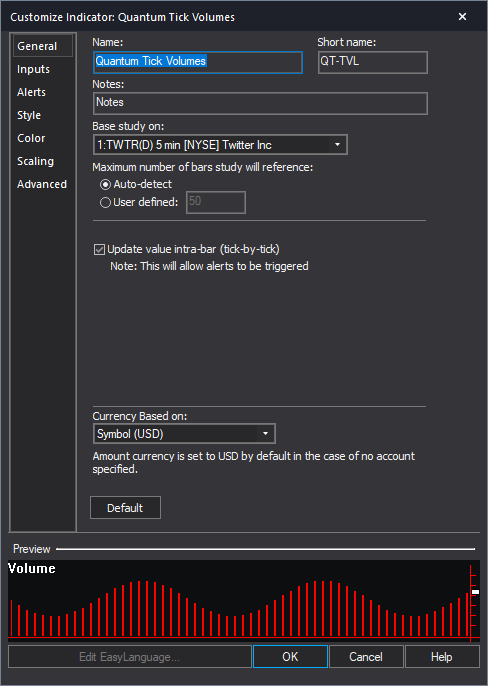
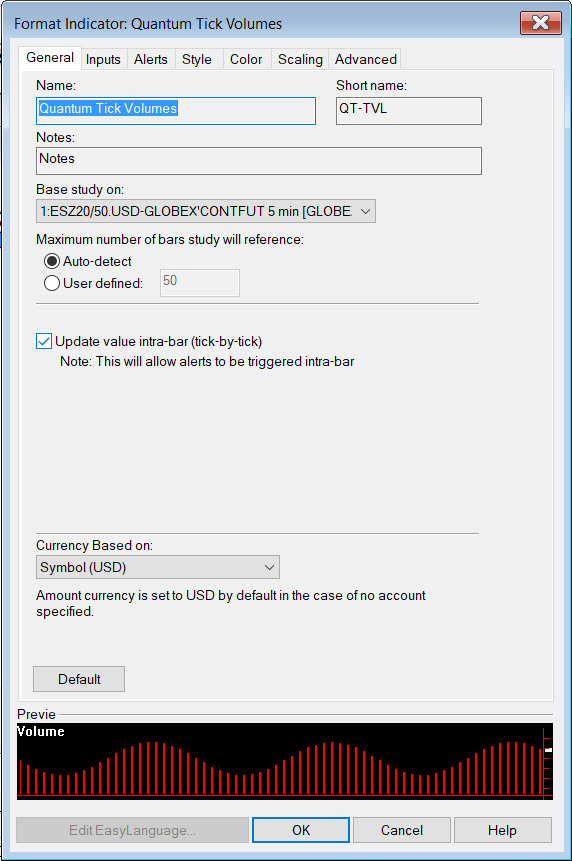
General
You can modify the name, short name, notes, maximum number of bars the indicator will reference, and more. We do not recommend changing any of the settings in this section but you can learn more about the different options in the General tab in TradeStation’s help guide at the link below.
http://help.tradestation.com/10_00/eng/tradestationhelp/study/customize_study_general.htm
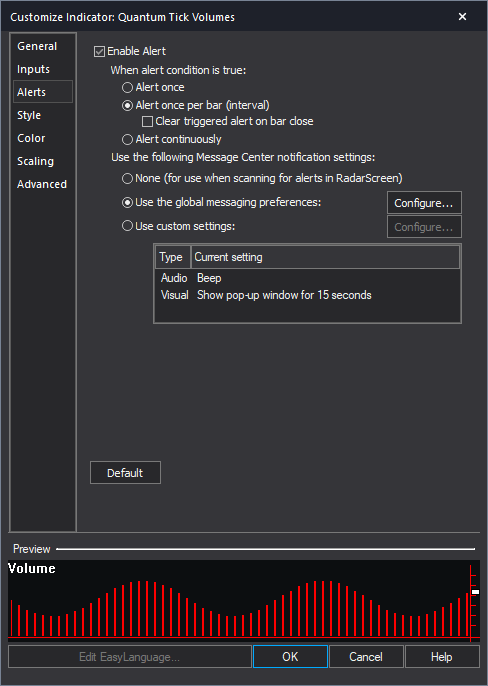
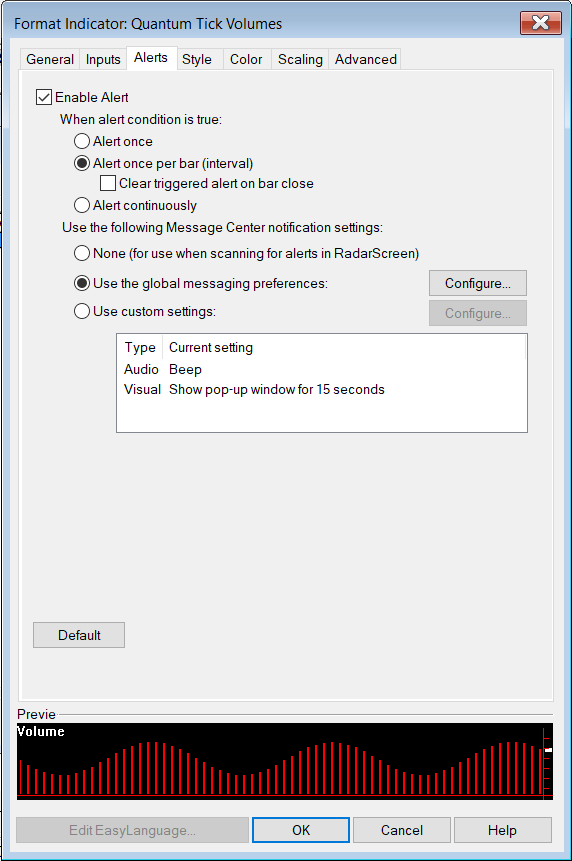
Alerts
The Quantum Tick Volumes indicator triggers alerts when the volume bar crosses above the middle volume line plot.
You can learn more about the different options in the Alerts tab in TradeStation’s help guide at the link below.
http://help.tradestation.com/10_00/eng/tradestationhelp/study/customize_study_alerts.htm
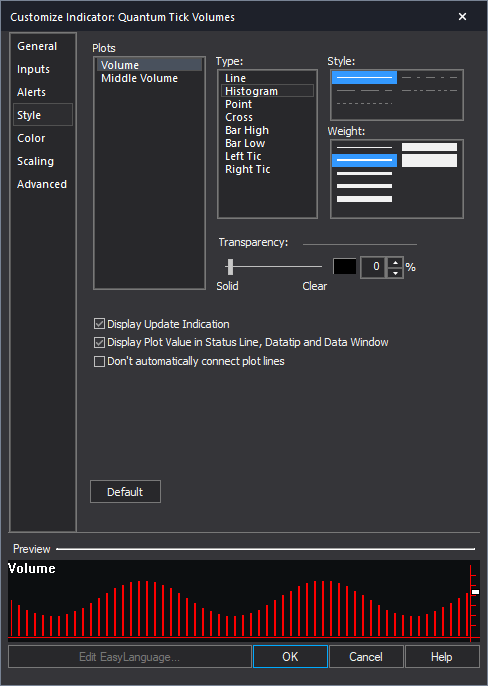
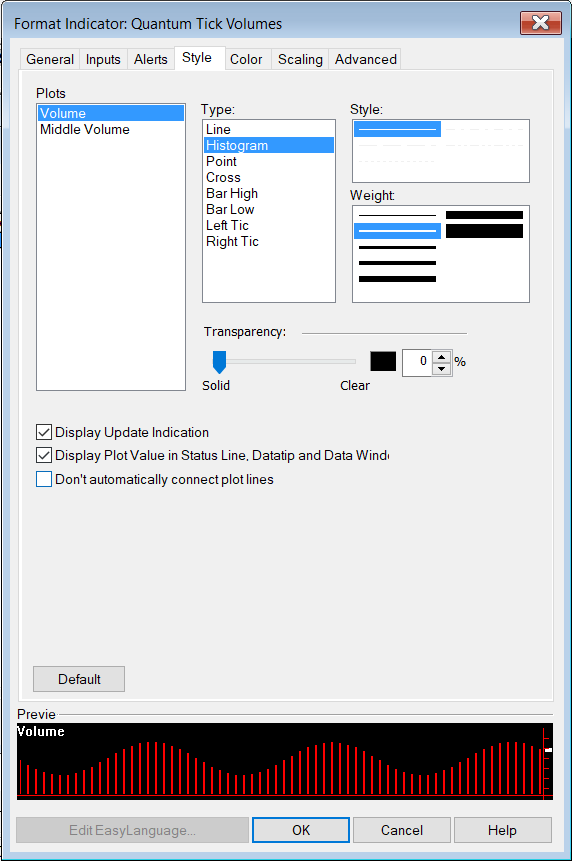
Style
The indicator uses a histogram plot to display the tick count for each bar and a dotted line plot for the middle volume. You can change the appearance of the plots such as their weight and style but for the volume plot, we suggest keeping the type to histogram.
You can learn more about the different options in the Style tab in TradeStation’s help guide at the link below.
http://help.tradestation.com/10_00/eng/tradestationhelp/study/customize_study_style.htm
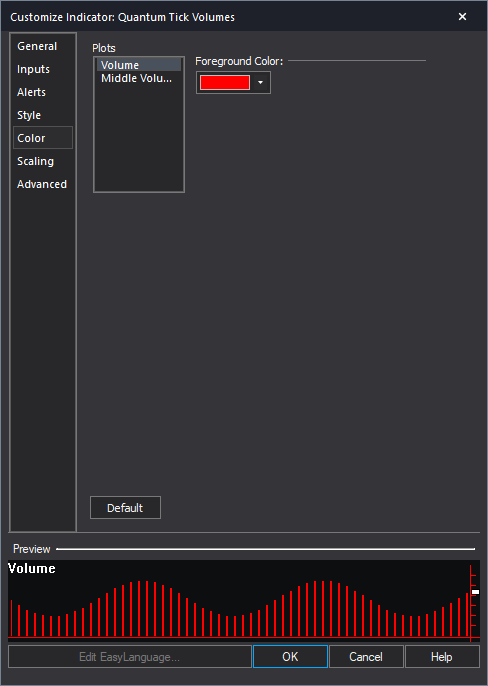
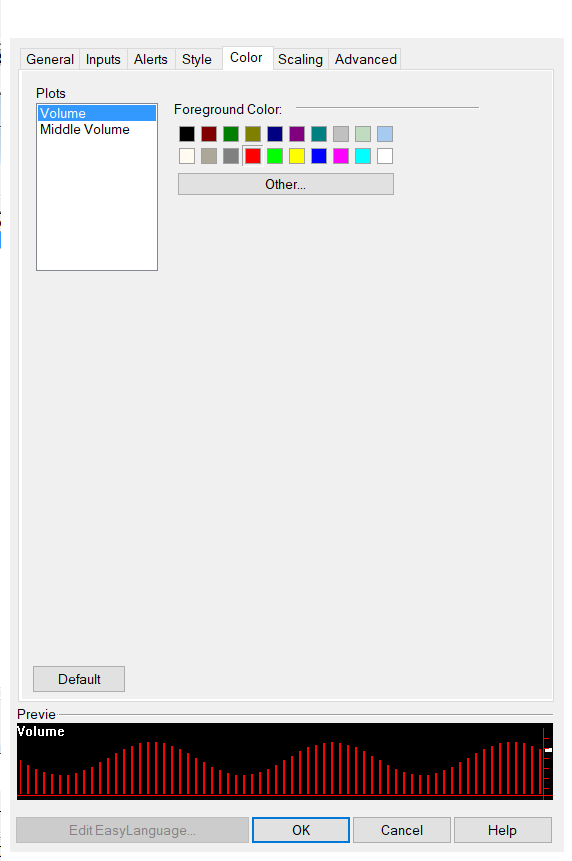
Color
The color of the volume bar is determined by the candlestick above it: red for a bearish price action and blue for a bullish one. Any change to this section does not affect the colors of the plot.
You can learn more about the different options in the Color tab in TradeStation’s help guide at the link below.
http://help.tradestation.com/10_00/eng/tradestationhelp/study/customize_study_color.htm
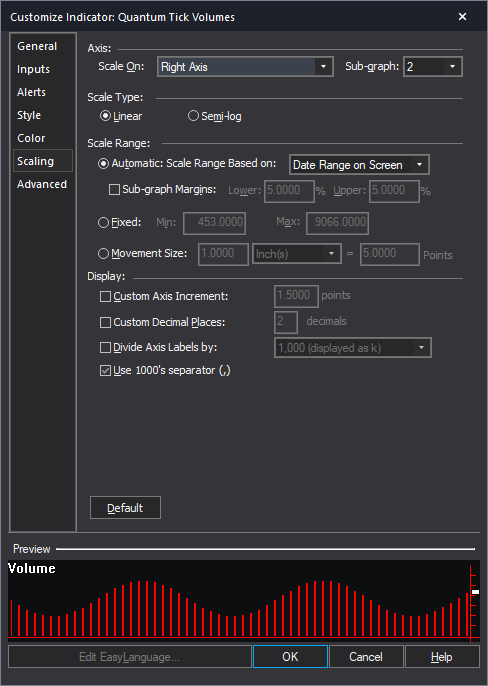
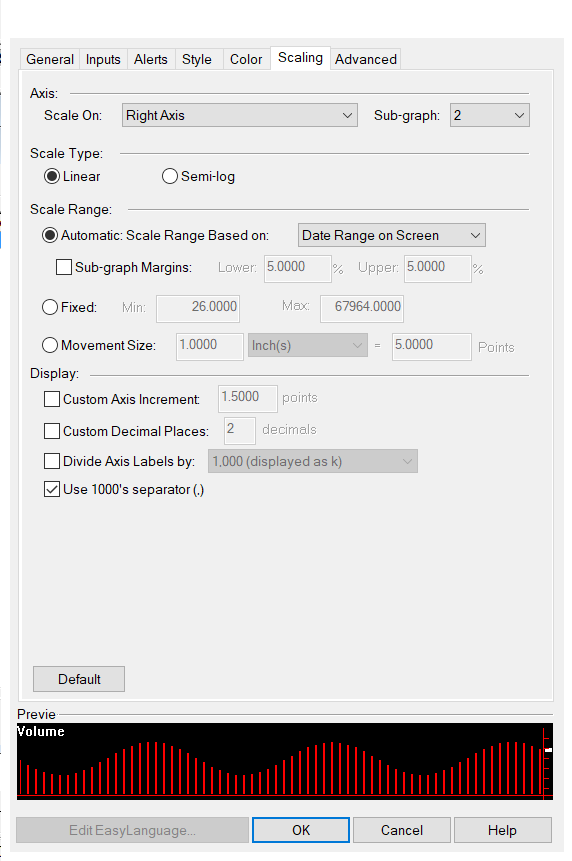
Scaling
The Scaling tab is used to modify the scaling settings for the y-axis of the indicator in the active Chart Analysis window. We do not recommend changing any of the settings in this section but you can learn more about the different options in the Scaling tab in TradeStation’s help guide at the link below.
http://help.tradestation.com/10_00/eng/tradestationhelp/study/customize_study_scaling.htm
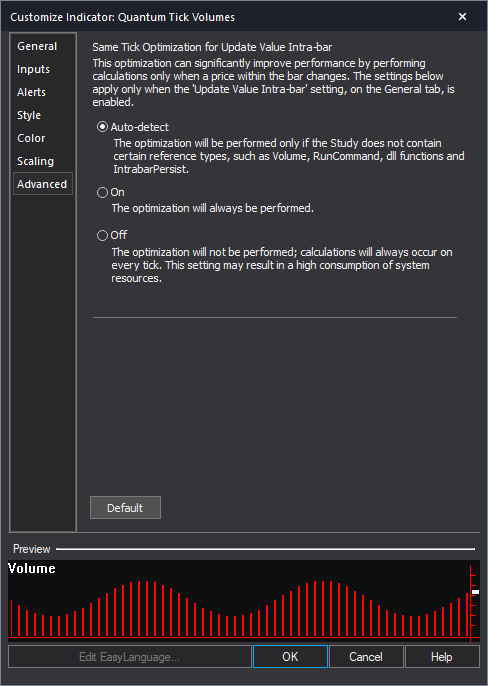
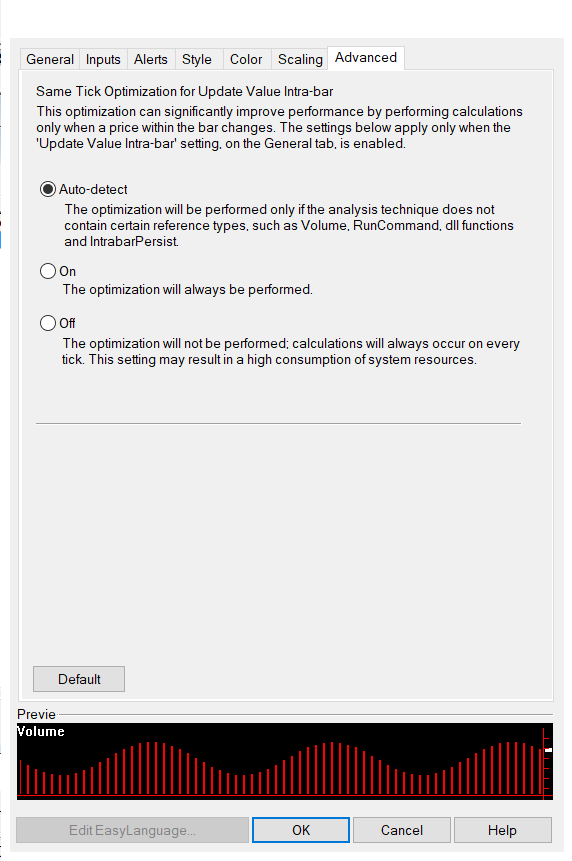
Advanced
The Advanced tab allows you to set advanced preferences for the indicator. We do not recommend changing any of the settings in this section but you can learn more about the different options in the Advanced tab in TradeStation’s help guide at the link below.
http://help.tradestation.com/10_00/eng/tradestationhelp/study/customize_study_advanced.htm
Removing the indicator from the Chart Analysis window
From the Chart Analysis window’s toolbar, please click Studies > Edit Studies…
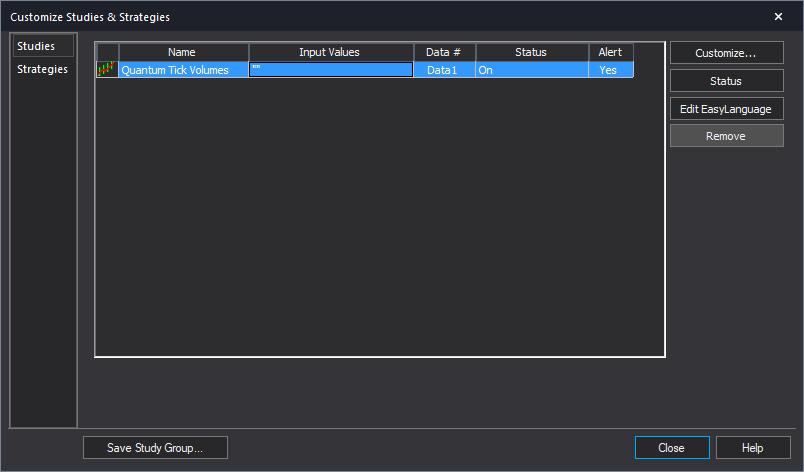
In the Studies tab, select Quantum Tick Volumes and click Remove then click Close.
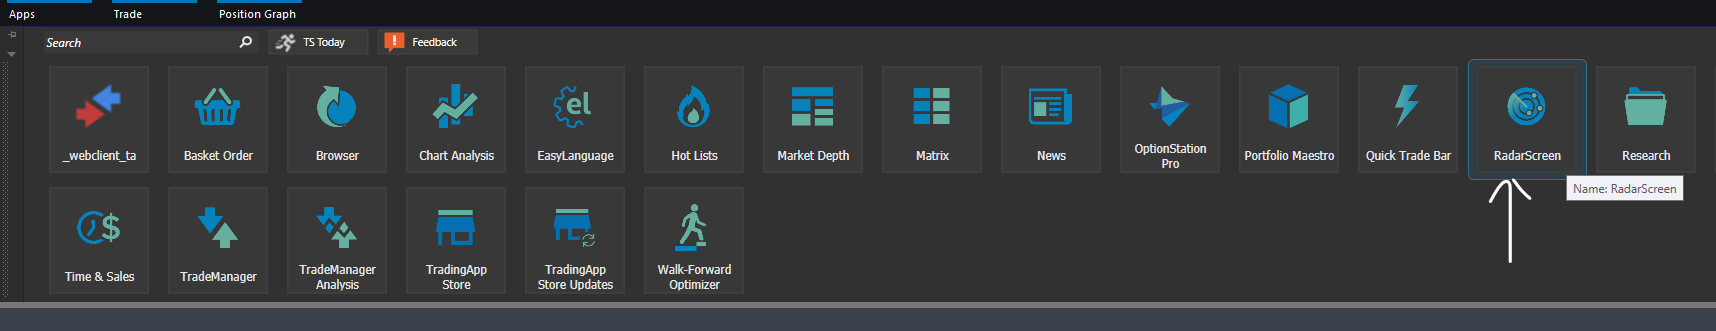
Applying the indicator to RadarScreen
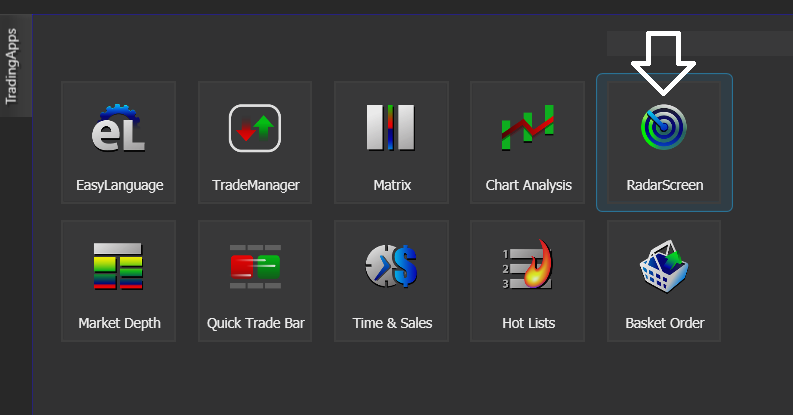
From the Apps menu of your TradeStation platform, please open a RadarScreen window.
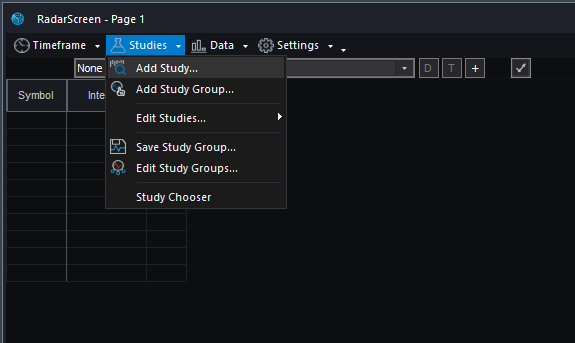
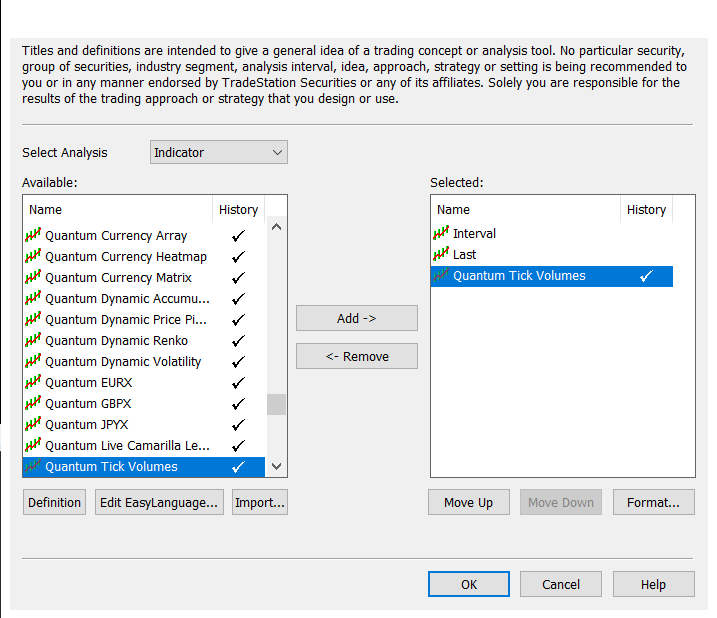
From the RadarScreen window’s toolbar, please click Studies > Add Study…
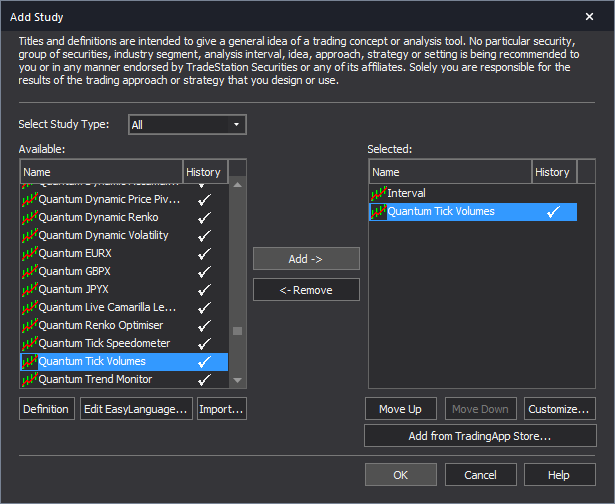
From the Add Study window, please choose Indicator at the left hand side of the interface then at the right, scroll down and select Quantum Tick Volumes. Click OK to apply the indicator to the chart.
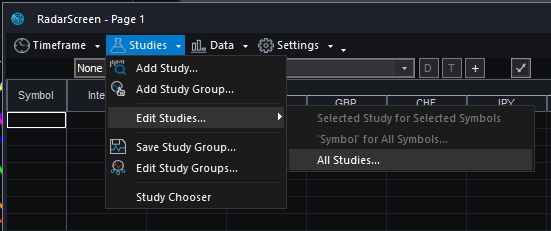
IMPORTANT: If this is your first time to run Quantum Trading indicators, the indicator will not work until you input your email address in its settings. To do this, please go back to your RadarScreen window and click Studies > Edit Studies… > All Studies…
Double-click the Quantum Tick Volumes to open the Customize Indicator window. In the Inputs section, find the MyQuantumTradingEmail input and enter here the email address you used at the Quantum Trading Shop to activate the indicator. PLEASE MAKE SURE TO ENCLOSE THE EMAIL ADDRESS IN DOUBLE QUOTATION MARKS. (example: “myemailaddress@gmail.com”)
Click OK (and Close) to save and go back to RadarScreen. Please note that you need to do this only once which means you do not need to input your email address again when running Quantum Trading indicators next time.
Compatible symbols in RadarScreen
The Quantum Tick Volumes indicator works with symbols that have trade volume. The indicator cannot be used with forex symbols in RadarScreen.
RadarScreen columns
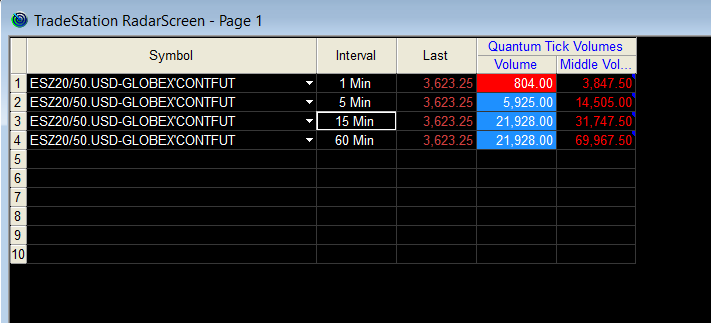
Volume
Displays the current volume of the symbol
Middle Volume
Displays half of the highest volume bar in the current day or Look Back period.
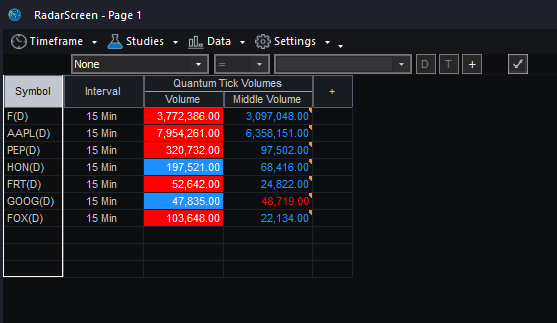
Color changes in the RadarScreen
The cell’s background and text color may change on certain conditions.
Background color changes
- The Volume column turns Red when the current candlestick is bearish.
- The Volume column turns Blue when current candlestick is bullish.
Text color changes
- The text of the Middle Volume column turns Red when the current volume is greater than (>) the middle volume.
- The text of the Middle Volume column turns Blue when the current volume is less than (<) the middle volume.
Removing the indicator from RadarScreen
From the RadarScreen window’s toolbar, please click Studies > Edit Study… > All Studies… then select/click Quantum Tick Volumes in the list at right hand side of the window. Click the “<- Remove” button then click OK to close the window.
Using the indicator in TradeStation Global
Applying the indicator to a Chart Analysis window
From the Apps menu of your TradeStation platform, please open a Chart Analysis window.
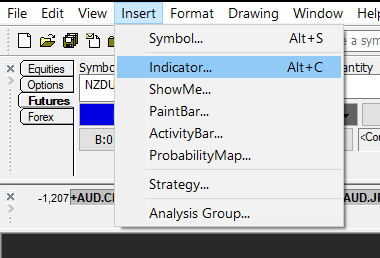
From the menu bar, click Insert > Indicator… > Indicator tab then scroll down at the list and select the Quantum Tick Volumes and click OK to apply the indicator in the chart.
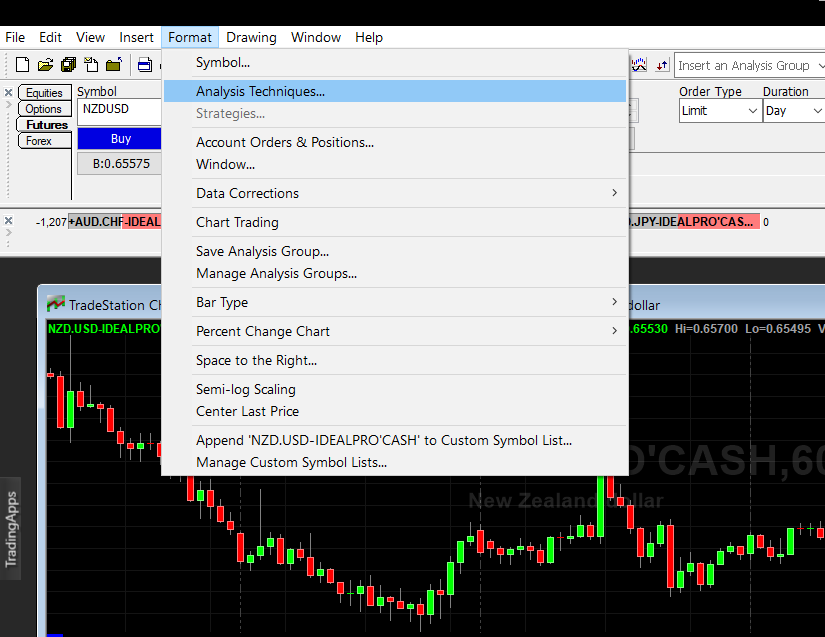
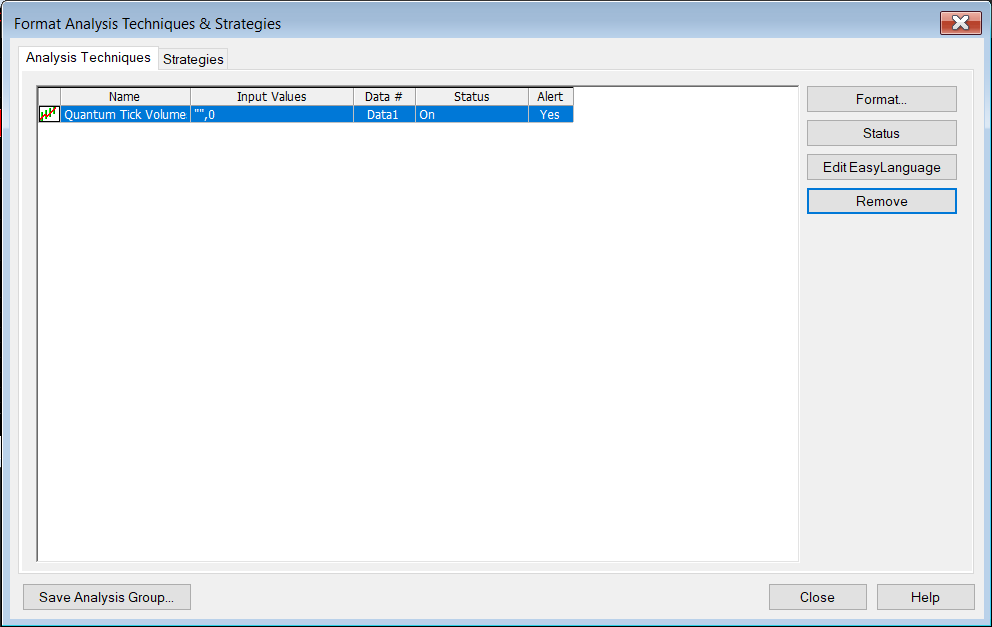
IMPORTANT: If this is your first time to run Quantum Trading indicators, the indicator will not work until you input your email address in its settings. To do this, please go back to your Chart Analysis window then in the menu bar, click Format > Analysis Techniques…
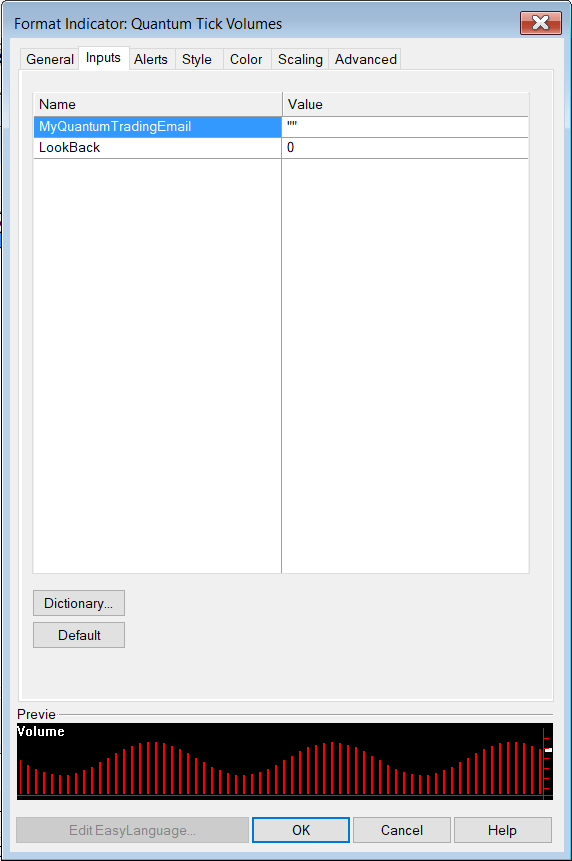
Select the indicator from the list then turn it On by clicking the Status button at the right hand side of the window. Click Format… or double-click the Quantum Tick Volumes to open the Format Indicator window. In the Inputs section, find the MyQuantumTradingEmail input and enter here the email address you used at the Quantum Trading Shop to activate the indicator. PLEASE MAKE SURE TO ENCLOSE THE EMAIL ADDRESS IN DOUBLE QUOTATION MARKS. (example: “myemailaddress@gmail.com”)
Click OK (and Close) to save and go back to your chart. Please note that you need to do this only once which means you do not need to input your email address again when running Quantum Trading indicators next time.
Customizing the indicator in Chart Analysis
Inputs
- MyQuantumTradingEmail – When running the indicator for the first time in your TradeStation trading account, you need to enter the email address you used to purchase the indicator in the Quantum Trading Shop as part of its verification process. You need to do this only once as the indicators “remember” your email address by storing it in the local drive. Please make sure that you enter your email address correctly and exactly without any extra spaces before and after it. If you made an error, simply fill this input again to update it. This is a string input which requires you to enclose your email address in double quotation marks (“”).
- LookBack – The Quantum Tick Volumes indicator includes a line that shows the user half of the day’s highest volume bar and because this is an intraday calculation, this is displayed in timeframes below Daily only. By adding a value greater than 0 to the LookBack input, the indicator shifts to a new mode where it calculates half of the highest volume bar within the LookBack period instead of the current day. In this mode, the middle volume line becomes visible in any timeframe and it allows you to analyze smaller segments of the chart.
General
You can modify the name, short name, notes, maximum number of bars the indicator will reference, and more. We do not recommend changing any of the settings in this section but you can learn more about the different options in the General tab in TradeStation’s help guide at the link below.
Alerts
The Quantum Tick Volumes indicator triggers alerts when the volume bar crosses above the middle volume line plot.
You can learn more about the different options in the Alerts tab in TradeStation’s help guide at the link below.
Style
The indicator uses a histogram plot to display the tick count for each bar and a dotted line plot for the middle volume. You can change the appearance of the plots such as their weight and style but for the volume plot, we suggest keeping the type to histogram.
You can learn more about the different options in the Style tab in TradeStation’s help guide at the link below.
Color
The color of the volume bar is determined by the candlestick above it: red for a bearish price action and blue for a bullish one. Any change to this section does not affect the colors of the plot.
You can learn more about the different options in the Color tab in TradeStation’s help guide at the link below.
Scaling
The Scaling tab is used to modify the scaling settings for the y-axis of the indicator in the active Chart Analysis window. We do not recommend changing any of the settings in this section but you can learn more about the different options in the Scaling tab in TradeStation’s help guide at the link below.
Advanced
The Advanced tab allows you to set advanced preferences for the indicator. We do not recommend changing any of the settings in this section but you can learn more about the different options in the Advanced tab in TradeStation’s help guide at the link below.
Removing the indicator from the Chart Analysis window
From the menu bar of your TradeStation platform, click Format > Analysis Techniques…
In the Analysis Techniques tab, select Quantum Tick Volumes and click Remove then click Close.
Applying the indicator to RadarScreen
From the Apps menu of your TradeStation platform, please open a RadarScreen window.
From the menu bar, click Insert > Indicator… > Indicator tab then scroll down at the indicators list at the left hand side and select the Quantum Tick Volumes. Click the Add -> button to apply the indicator in the RadarScreen. You can change the order of the indicators by clicking the Move up and Move down buttons while the indicator is selected in the list at the right hand side.
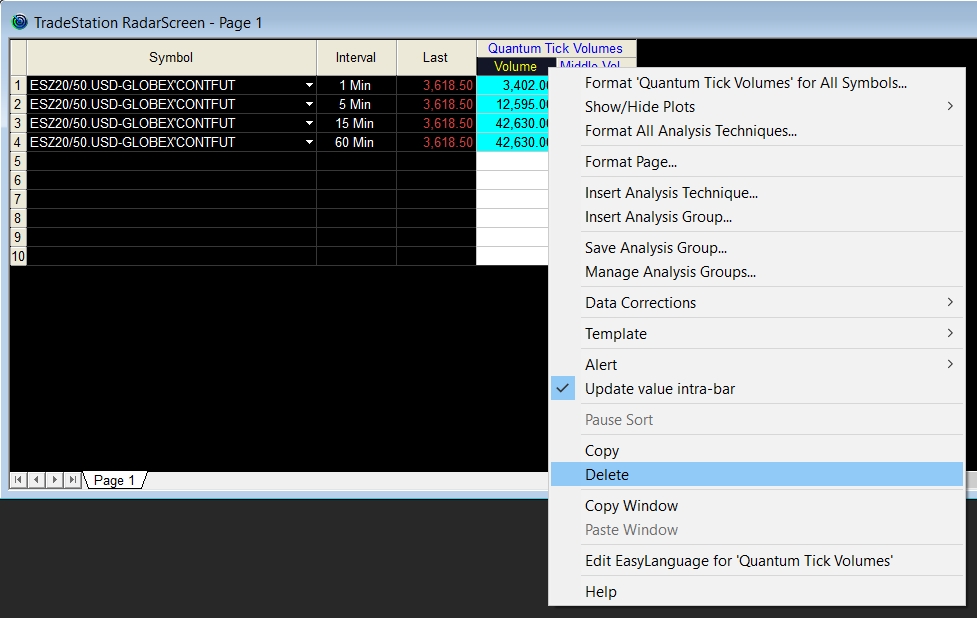
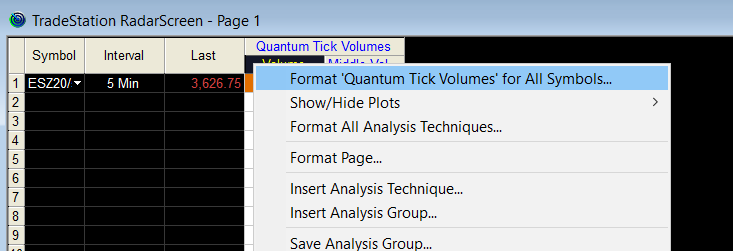
IMPORTANT: If this is your first time to run Quantum Trading indicators, the indicator will not work until you input your email address in its settings. To do this, please go back to your RadarScreen window and right-click the Quantum Tick Volumes’ column header then select Format ‘Quantum Tick Volumes’ for all Symbols…
In the Inputs tab, find the MyQuantumTradingEmail input and enter here the email address you used at the Quantum Trading Shop to activate the indicator. PLEASE MAKE SURE TO ENCLOSE THE EMAIL ADDRESS IN DOUBLE QUOTATION MARKS. (example: “myemailaddress@gmail.com”)
Click OK to save and go back to RadarScreen. Please note that you need to do this only once which means you do not need to input your email address again when running Quantum Trading indicators next time.
Compatible symbols in RadarScreen
The Quantum Tick Volumes indicator works in symbols that have historical volume data only.
RadarScreen columns
Volume
Displays the current volume of the symbol
Middle Volume
Displays half of the highest volume bar in the current day or Look Back period.
Color changes in the RadarScreen
The cell’s background and text color may change on certain conditions.
Background color changes
- The Volume column turns Red when the current candlestick is bearish.
- The Volume column turns Blue when current candlestick is bullish.
Text color changes
- The text of the Middle Volume column turns Red when the current volume is greater than (>) the middle volume.
- The text of the Middle Volume column turns Blue when the current volume is less than (<) the middle volume.
Removing the indicator from RadarScreen
From the RadarScreen window, right-click the Quantum Tick Volumes’ column header then select Delete.