Overview Of The Currency Strength Indicator for Tradestation
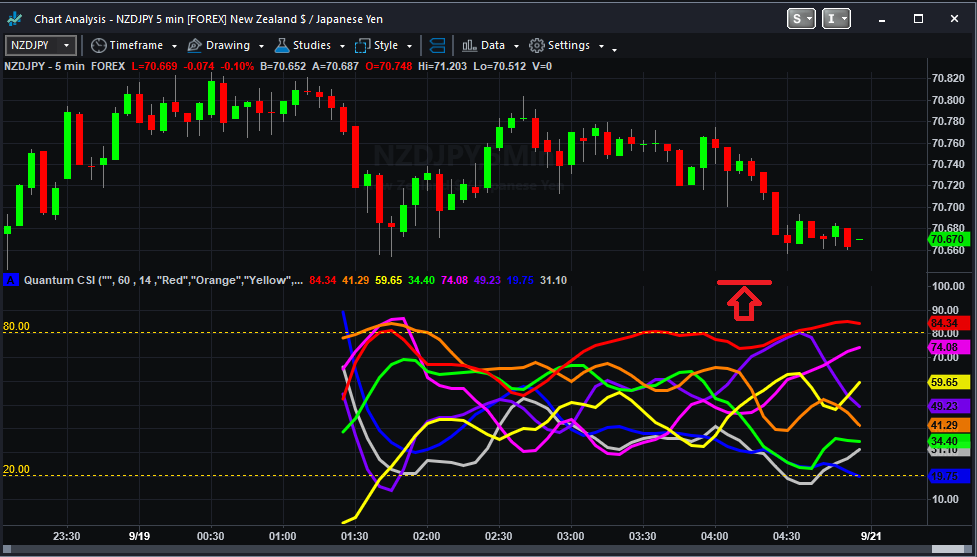
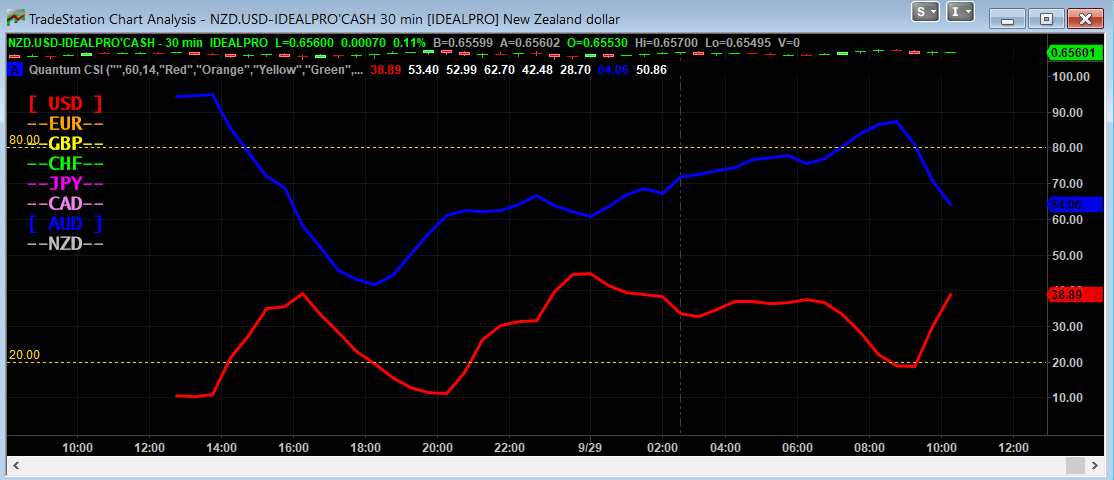
The Quantum Currency Strength Indicator has been designed to show you easily and quickly when a currency is moving strongly in one direction or another, either to an oversold state, or to an overbought state. Currencies and currency pairs move constantly from one to the other in all timeframes.
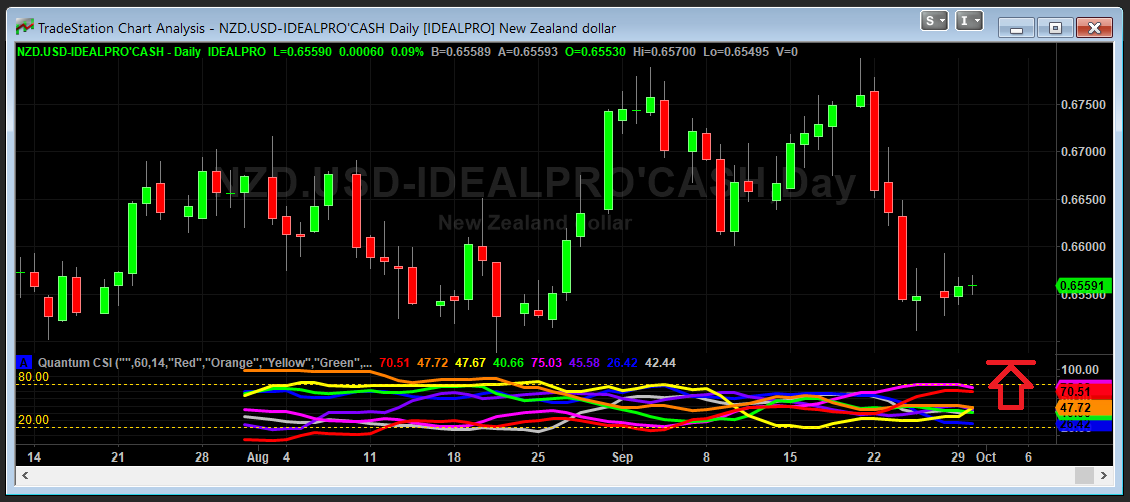
These are the points at which a currency is likely to reverse and change trend. The overbought and oversold regions on the indicator are defined by the lines at 20 and 80, and once these regions are approached then this is a signal for further analysis on the chart. Using the Currency Strength Indicator on TradeStation in multiple timeframes is an excellent way to see whether a currency is rising or falling across several timeframes, adding a further dimension to your analysis, and allowing you to quantify the risk on any trade in a more detailed way.
Whilst this indicator has been designed to show you when currencies are potentially overbought or oversold, the Quantum Currency Strength Indicator will also show you when currencies are in congestion phases as they meander and bunch together. Typically this is seen ahead of major news releases as the currency markets pause and wait before the release.
The indicator is your radar on the market, guiding you to those currency pairs which may be rising strongly or falling strongly, and just as important those pairs which are not moving at present.
Finally, the indicator will also help you monitor current positions, with the indicator showing you when a currency moved from one extreme to another and perhaps signaling a potential reversal in the opposite direction.
- Your Quantum Currency Strength Indicator (CSI) can be applied to any chart for any symbol. The chart does not influence or affect the appearance or performance of the indicator. For example, you can apply the indicator to a GBP/USD, an EUR/USD, a USD/CHF, or any other pair. The indicator will display in an identical way on each chart.
- The indicator will work in all timeframes from seconds to minutes, hours and months on the TradeStation platform.
- When you first apply the indicator, please allow a few seconds for the data to build in history.
- The lines at the top and bottom of the indicator (80 at the top and 20 at the bottom) are not designed as an entry or exit signal. They are simply there to give a guide as to when a currency is approaching or moving into an oversold or overbought region in that timeframe.
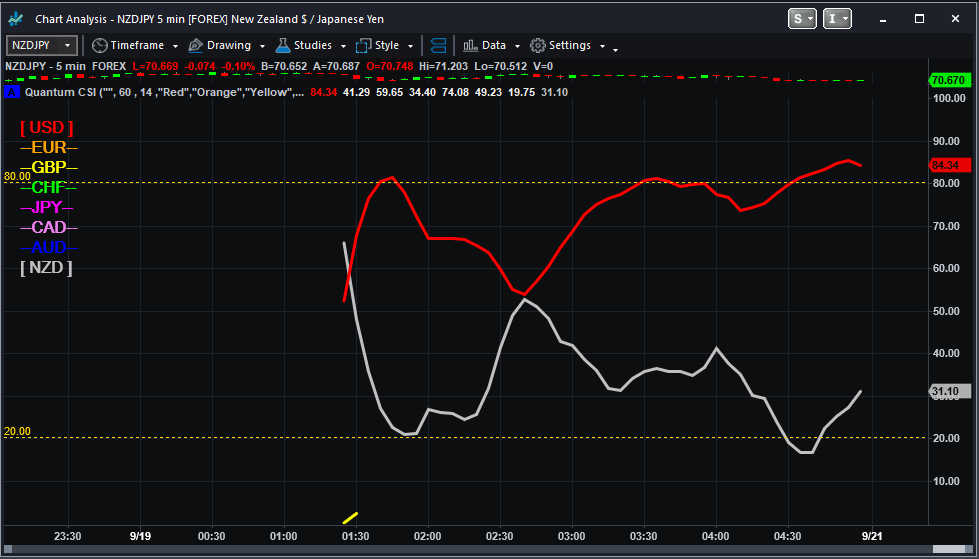
Currency lines
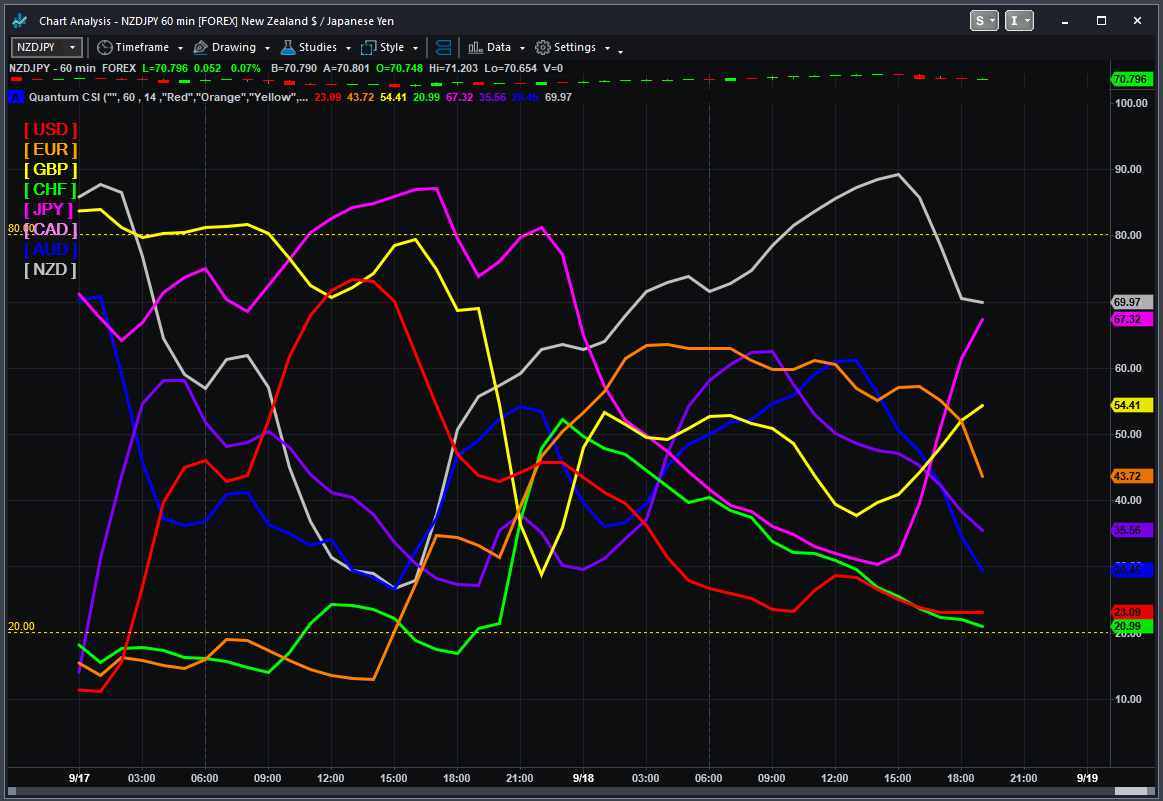
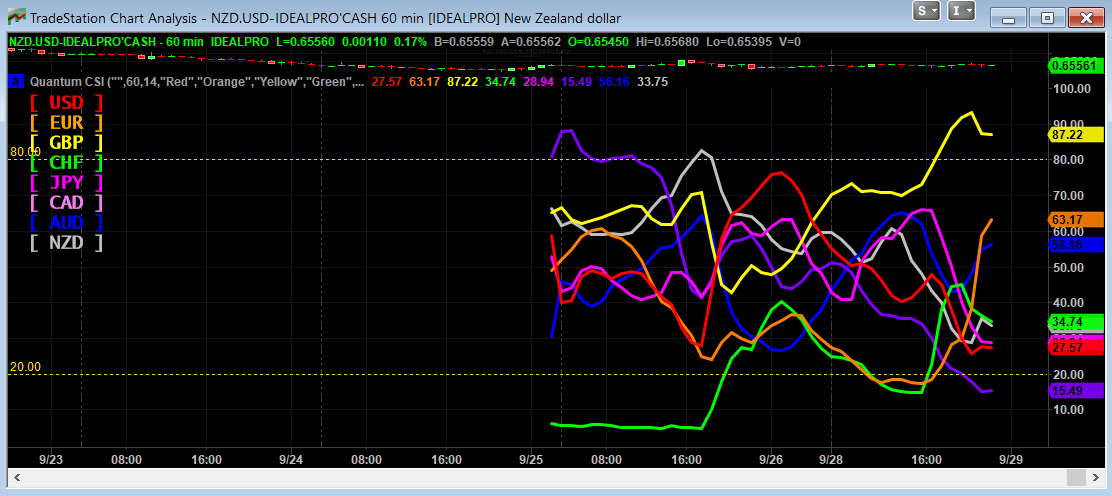
Each currency is represented by a line which is color coded as follows:
- US Dollar – Red
- Euro – Orange
- British Pound – Yellow
- Swiss Franc – Green
- Japanese Yen – Magenta
- Canadian Dollar – Purple
- Australian Dollar – Blue
- New Zealand Dollar – Grey
To identify each line easily, you can use as reference the colored currency labels at the left hand side of the chart. These labels can also be used to display or hide the currency they represent.
Currency Dashboard
By itself, the Quantum Currency Strength Indicator is a powerful trading tool for identifying trading opportunities quickly and easily on a single chart. However, its development is part of a new indicator bundle that we like to call the Quantum Currency Dashboard which consists of the following indicators:
- Quantum Currency Strength Indicator (CSI)
- Quantum Currency Matrix
- Quantum Currency Array
- Quantum Currency Heatmap
These four indicators provide a unique and compact insight into all the various aspects of strength and weakness for both currencies and currency pairs from trend and momentum to overbought and oversold. What is unique is that using four charts you are then able to monitor the myriad combinations of strength, weakness, momentum, congestion and divergence across the entire forex complex at a click of a button. And even more powerfully giving you the confidence to get in and stain for maximum profits. No more missed opportunities, no more struggling with multiple charts, and no more trader regret whatever your trading style approach.
Using the indicator in TradeStation Securities
Applying the indicator to a Chart Analysis window
From the Apps menu of your TradeStation platform, please open a Chart Analysis window.
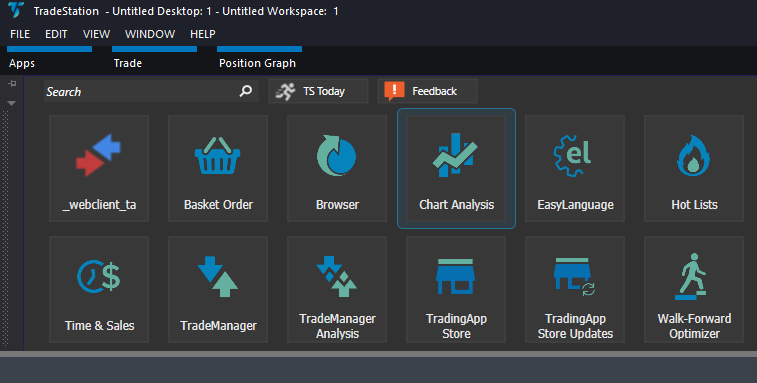
From the Chart Analysis window’s toolbar, please click Studies > Add Study…
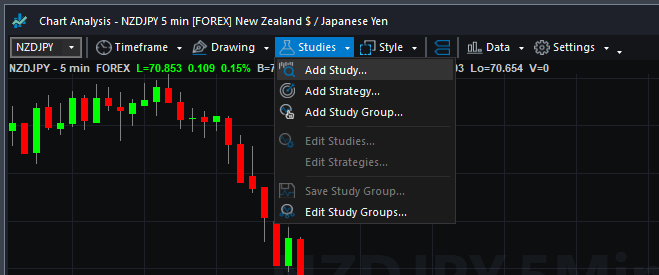
From the Add Study window, please choose Indicator at the left hand side of the interface then at the right, scroll down and select Quantum CSI. Click OK to apply the indicator to the chart.

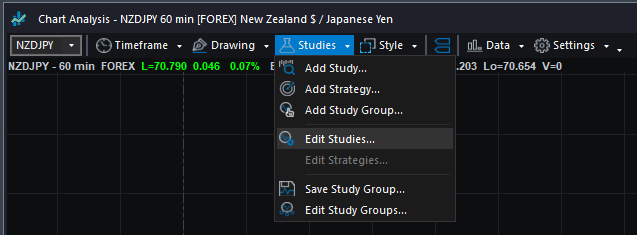
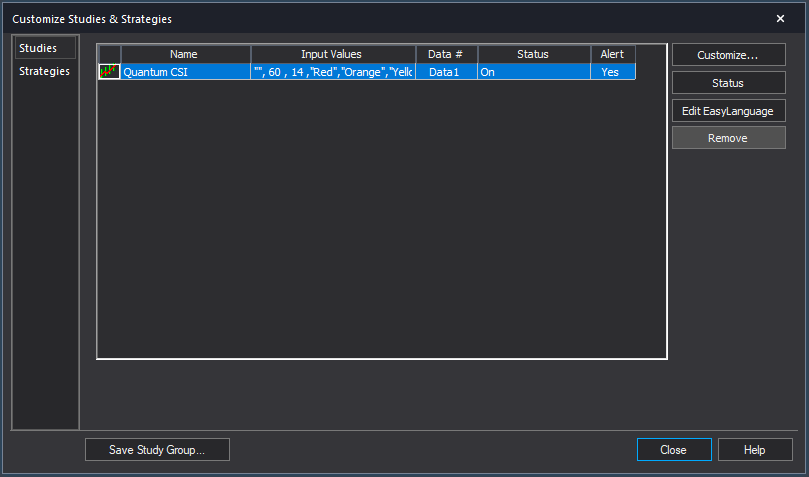
IMPORTANT: If this is your first time to run Quantum Trading indicators, the indicator will not work until you input your email address in its settings. To do this, please go back to your Chart Analysis window and click Studies > Edit Studies…
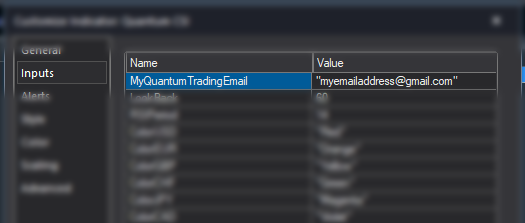
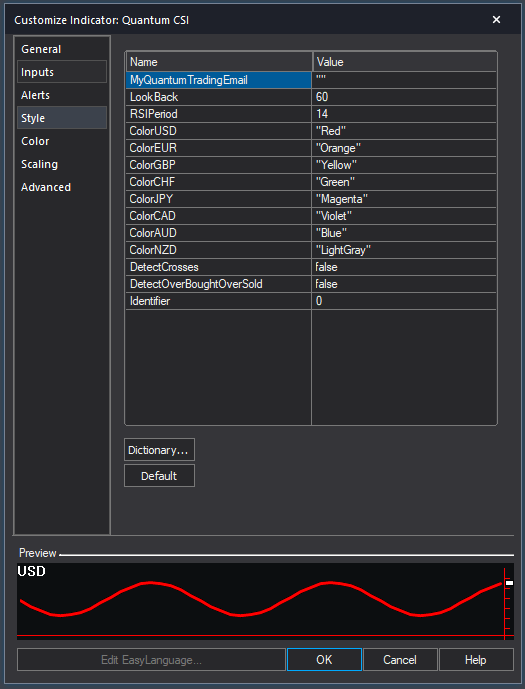
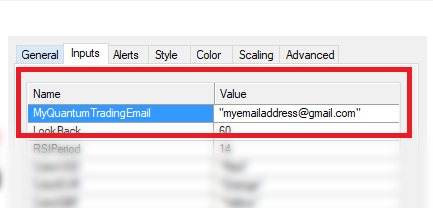
Select the indicator from the list then turn it On by clicking the Status button at the right hand side of the window. Click Customize… or double-click the Quantum CSI to open the Customize Indicator window. In the Inputs section, find the MyQuantumTradingEmail input and enter here the email address you used at the Quantum Trading Shop to activate the indicator. PLEASE MAKE SURE TO ENCLOSE THE EMAIL ADDRESS IN DOUBLE QUOTATION MARKS. (example: “myemailaddress@gmail.com”)
Click OK (and Close) to save and go back to your chart. Please note that you need to do this only once which means you do not need to input your email address again when running Quantum Trading indicators next time.
Customizing the indicator in Chart Analysis
Inputs
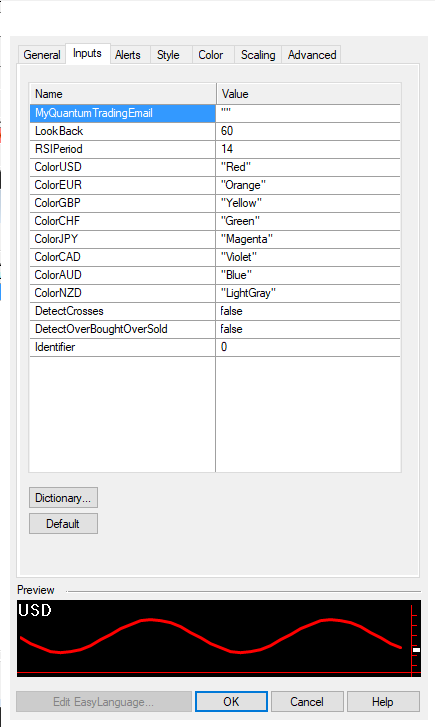
- MyQuantumTradingEmail – When running the indicator for the first time in your TradeStation trading account, you need to enter the email address you used to purchase the indicator in the Quantum Trading Shop as part of its verification process. You need to do this only once as the indicators “remember” your email address by storing it in the local drive. Please make sure that you enter your email address correctly and exactly without any extra spaces before and after it. If you made an error, simply fill this input again to update it. This is a string input which requires you to enclose your email address in double quotation marks (“”).
- LookBack – The CSI requires a significant amount of processing power compared to most indicators and this input limits it to calculate the last 60 bars by default. The higher the value of this input is, the more processing power is required, although you can change this if you wish to extend its coverage in the bar history.
- RSIPeriod – This setting is used to “fine tune” the internal RSI indicator of the Currency Strength Indicator. Increasing the value makes the indicator less responsive to price movement, thus the steepness of the curves decrease. A higher RSI Period also means that currencies are less likely to cross the 80 and 20 lines. Conversely, decreasing it, makes the indicator more responsive to price movement, thus the steepness of the curves increase. A lower RSI Period also means that currencies are more likely to cross the 80 and 20 lines and also stay there for longer periods of time. The recommended settings are between a minimum of 7 and a maximum of 14. For medium to longer term trading approaches then the higher RSI Period is recommended (towards 14 or the default), whilst for faster scalping trading approaches, then a lower RSI Period can be applied (towards 7).
- ColorUSD, ColorEUR, ColorGBP, ColorCHF, ColorJPY, ColorCAD, ColorAUD, ColorNZD – These inputs define the colors of the Quantum CSI with their respective currency. These changes both the color of the line and its corresponding currency label. They are also string inputs which means you need to enclose the name color in double quotation marks (“”). Named colors are the only accepted values in these inputs which are all listed in the following link –
http://help.tradestation.com/09_01/tsdevhelp/Subsystems/elobject/class_win/color_class.htm
The color of a line reverts to the default named color if the input’s value is invalid. - DetectCrosses – A currency cross happens when one currency line intersects with another which indicates a significant price action between the two currencies, and signals the development of a trend which is already in place. This input makes sure that the indicator checks for crosses at each calculation when Alerts are enabled. Its value can either be true or false.
- DetectOverBoughtOverSold – A currency is said to be overbought or oversold when its line in the Quantum CSI crosses the 80 or 20 level respectively. This input makes sure that the indicator checks for overbought and oversold currencies as they happen when Alerts are enabled.
- Identifier – We strongly advise changing the value of this Input when running 2 (or more) instances of the Quantum CSI in the same chart. By changing the value of the Identifier input, it allows the indicator to store different combinations of visible currency lines in each instance of the Quantum CSI.
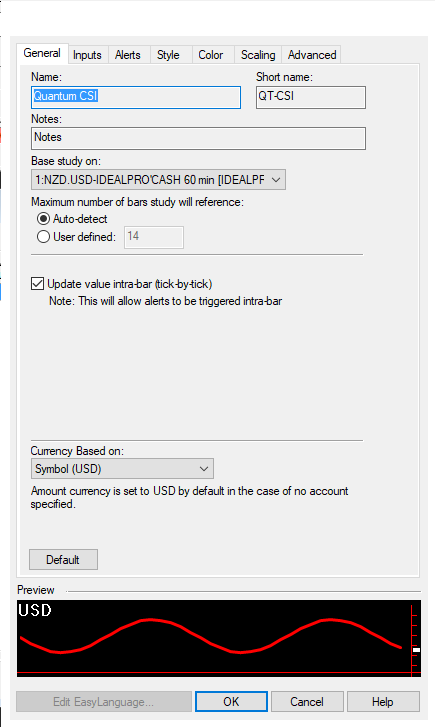
General
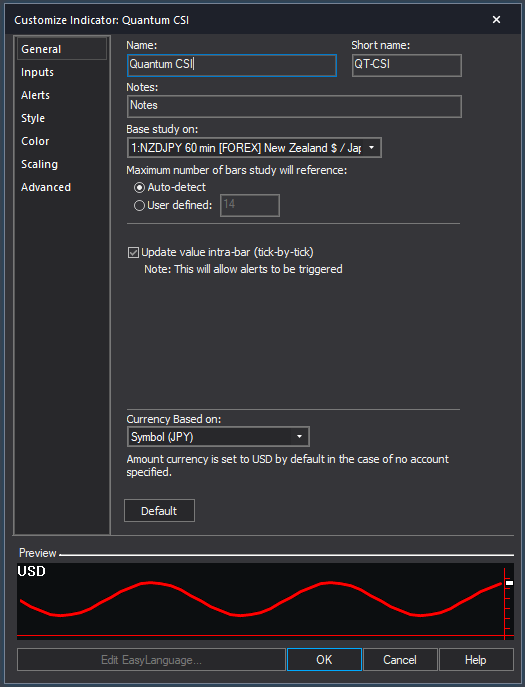
You can modify the name, short name, notes, maximum number of bars the indicator will reference, and more. We do not recommend changing any of the settings in this section but you can learn more about the different options in the General tab in TradeStation’s help guide at the link below.
http://help.tradestation.com/10_00/eng/tradestationhelp/study/customize_study_general.htm
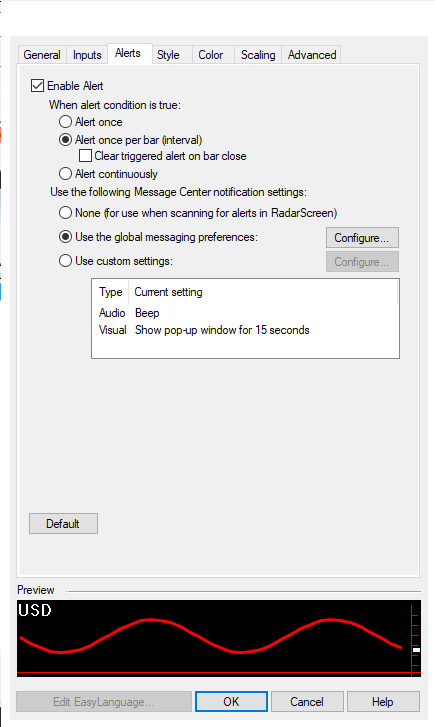
Alerts
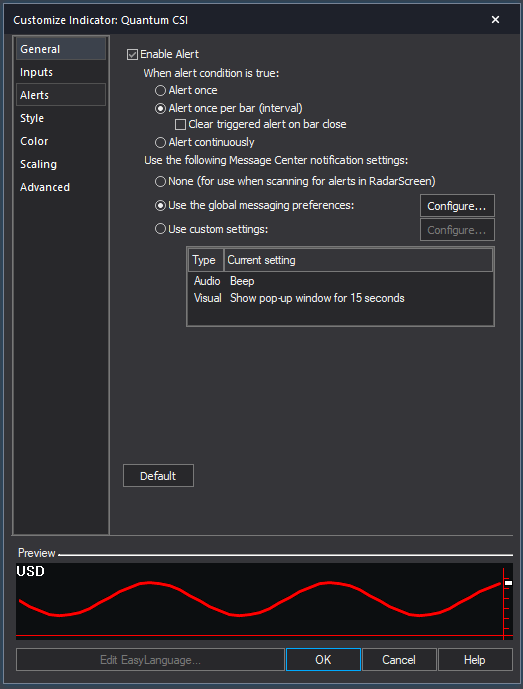
This section controls the alert functions of the indicator. Alerts are enabled in the indicator by default but please note that the Quantum CSI allows you to choose which kind of messages you like to be alerted to you when they trigger. Please see the DetectCrosses and DetectOverBoughtOverSold inputs in the Inputs section for more details.
You can learn more about the different options in the Alerts tab in TradeStation’s help guide at the link below.
http://help.tradestation.com/10_00/eng/tradestationhelp/study/customize_study_alerts.htm
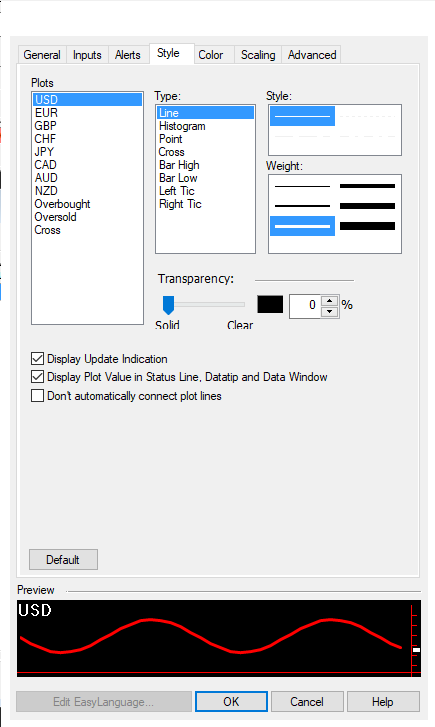
Style
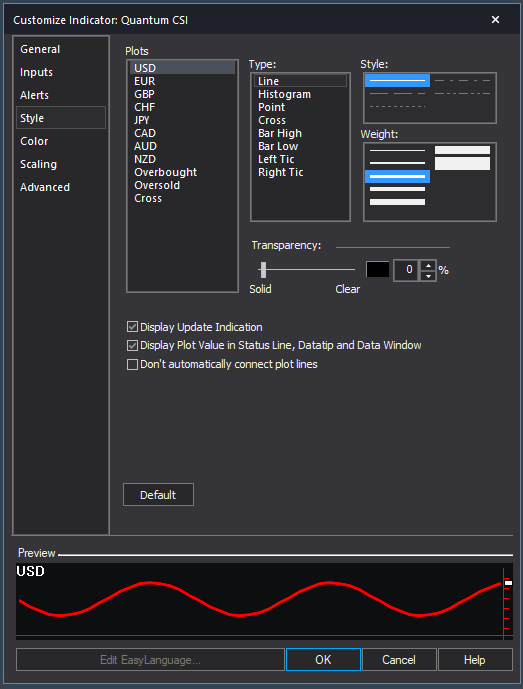
You can change the properties of the plot lines in this section such as the weight (thickness) and style of each line.
You can learn more about the different options in the Style tab in TradeStation’s help guide at the link below.
http://help.tradestation.com/10_00/eng/tradestationhelp/study/customize_study_style.htm
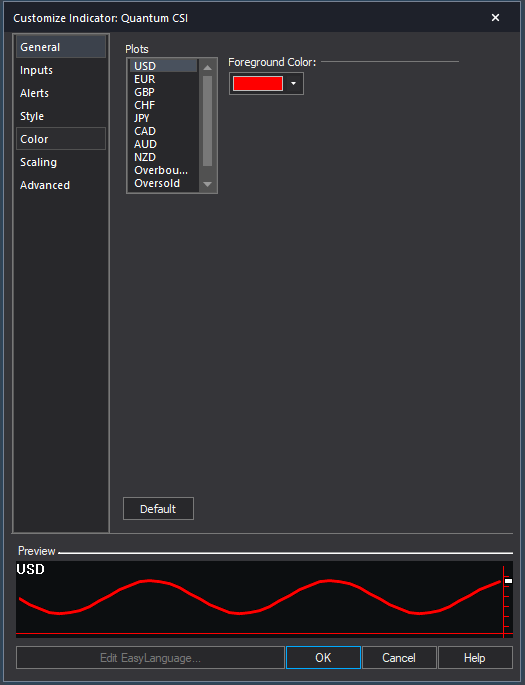
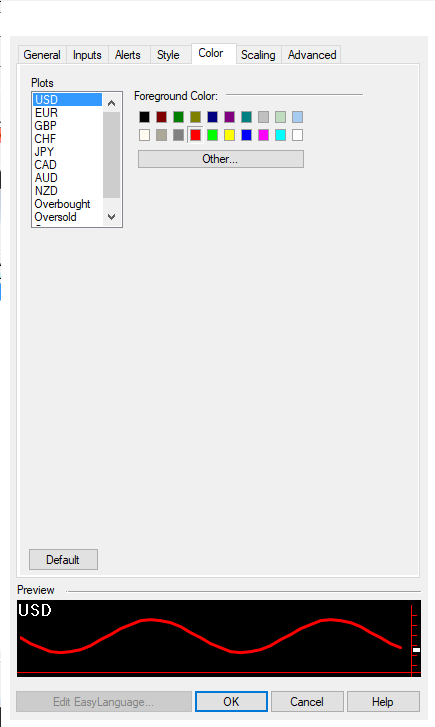
Color
We do not recommend changing the colors of the indicator in this section. Instead, please use the “Color…” inputs defined in its Inputs to safely change the color of each currency.
You can learn more about the different options in the Color tab in TradeStation’s help guide at the link below.
http://help.tradestation.com/10_00/eng/tradestationhelp/study/customize_study_color.htm
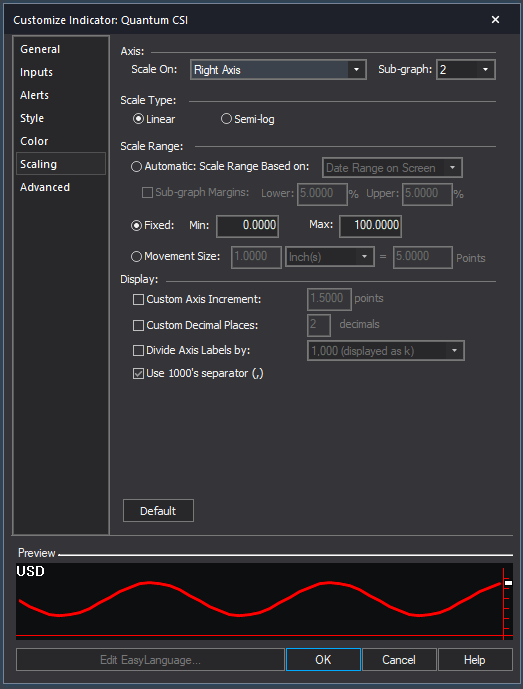
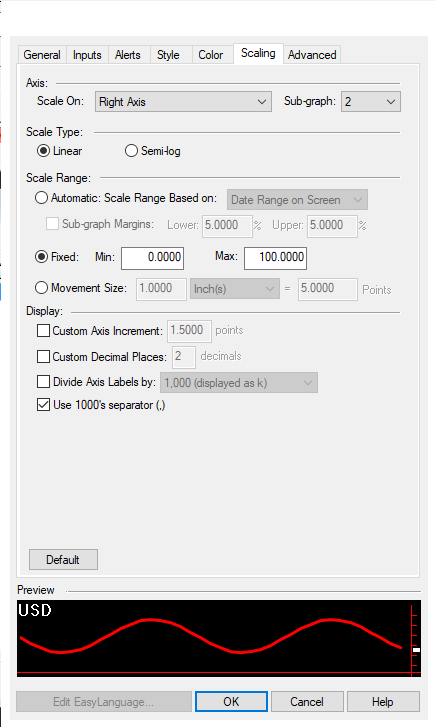
Scaling
The Scaling tab is used to modify the scaling settings for the y-axis of the indicator in the active Chart Analysis window. We do not recommend changing any of the settings in this section but you can learn more about the different options in the Scaling tab in TradeStation’s help guide at the link below.
http://help.tradestation.com/10_00/eng/tradestationhelp/study/customize_study_scaling.htm
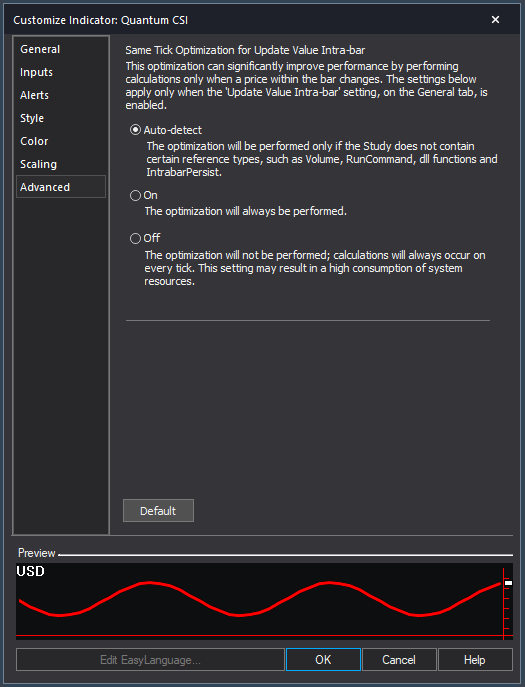
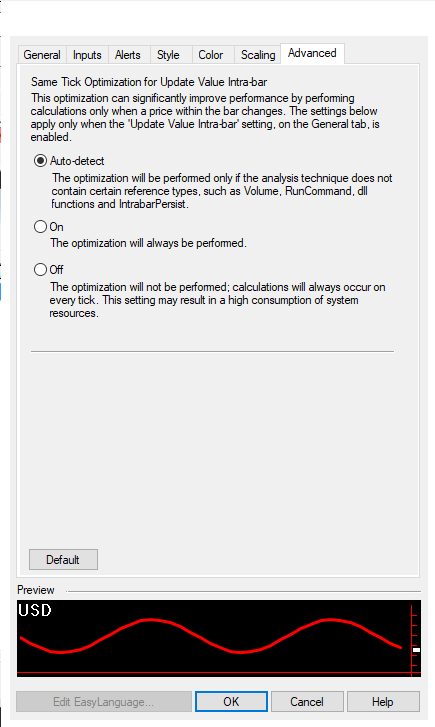
Advanced
The Advanced tab allows you to set advanced preferences for the indicator. We do not recommend changing any of the settings in this section but you can learn more about the different options in the Advanced tab in TradeStation’s help guide at the link below.
http://help.tradestation.com/10_00/eng/tradestationhelp/study/customize_study_advanced.htm
Making adjustments to the user interface in Chart Analysis
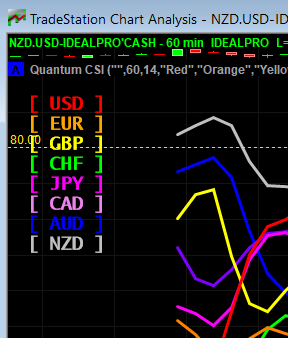
Currency Buttons
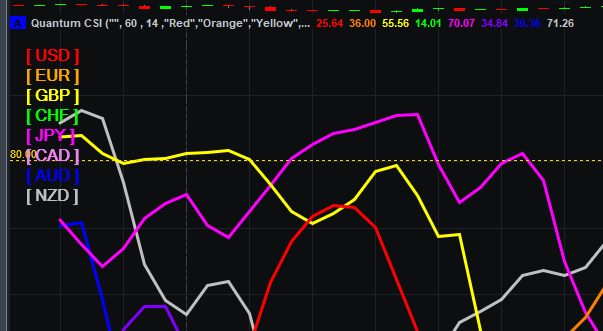
The currency buttons are the colored text enclosed in square brackets located at the left hand side of the indicator. Please note that you need to extend the border of the indicator vertically to reveal the currency buttons. Please see the section below for more details.
Each button corresponds to one of the lines in the indicator that matches its color. Each button contains the symbol of the currency and clicking a button toggles the visibility of the line it corresponds to. A button can be one of 2 states: NOT PRESSED or PRESSED. A button is pressed when the square brackets around it turns to dashes.
For example: [USD] is not pressed while –USD– is pressed.
- If the button is NOT PRESSED, the corresponding currency line is visible in the CSI. In this state, the button has square brackets around it.
- If the button IS PRESSED, the corresponding currency line is hidden. In this state, the button has dashes around it.
This way, you can easily focus on a currency or group of currencies conveniently. Also, your toggled buttons are saved for each timeframe so you can be sure that the same buttons are pressed when you reopen your TradeStation client.
Expanding the Indicator’s Screen Size
Follow the steps below to expand the Quantum CSI’s screen size in the chart.
- Hover your mouse pointer over the space between the Quantum CSI and the chart above it until the mouse cursor changes into a double headed arrow
- HOLD down the left click on your mouse, and drag the mouse to the top until all currency buttons are visible
- Hover your mouse over the right hand edge of the chart until a double headed arrow appears
- HOLD down the left click on your mouse, and drag the right hand edge of the chart across to the left and release when done
- Click on the chart to make it the active window
- Click on the Increase Spacing – Up Arrow icon below, to expand your indicator to full size. The Increase Spacing – Up Arrow button is shown below when you hover over the bottom portion of the chart window.
Removing the indicator from the Chart Analysis window
From the Chart Analysis window’s toolbar, please click Studies > Edit Studies…
In the Studies tab, select Quantum CSI and click Remove then click Close.
Applying the indicator to RadarScreen
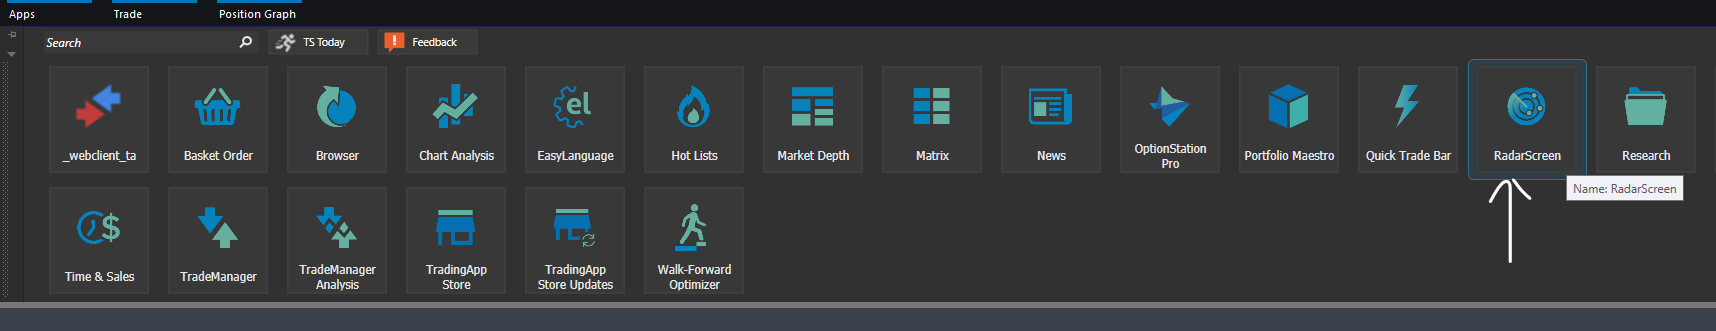
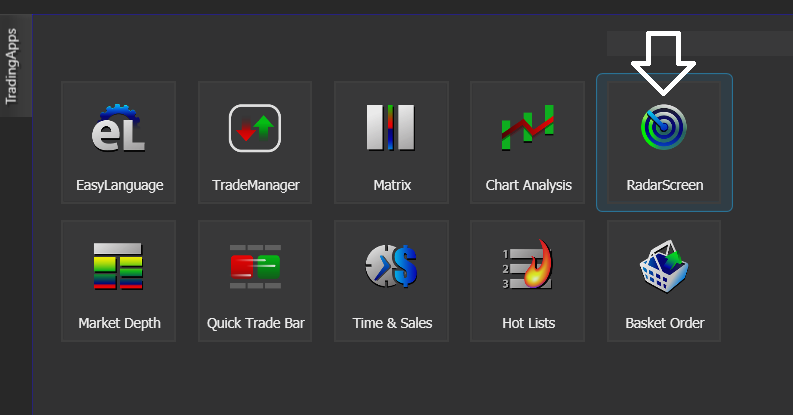
From the Apps menu of your TradeStation platform, please open a RadarScreen window.
From the RadarScreen window’s toolbar, please click Studies > Add Study…
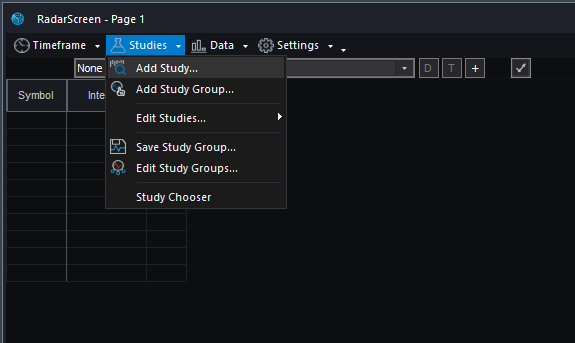
From the Add Study window, please choose Indicator at the left hand side of the interface then at the right, scroll down and select Quantum CSI. Click OK to apply the indicator to the chart.
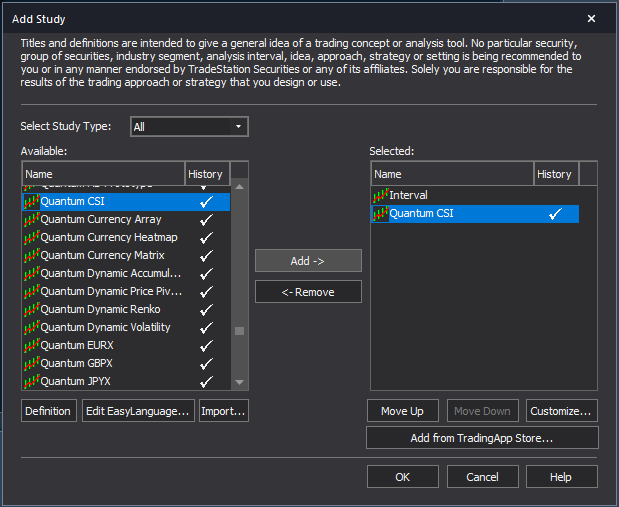
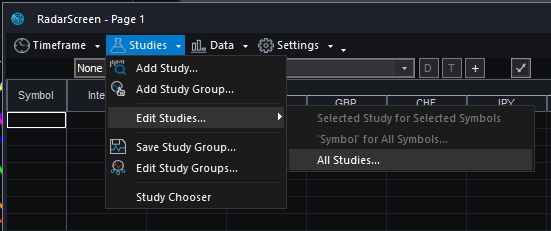
IMPORTANT: If this is your first time to run Quantum Trading indicators, the indicator will not work until you input your email address in its settings. To do this, please go back to your RadarScreen window and click Studies > Edit Studies… > All Studies…
Double-click the Quantum CSI to open the Customize Indicator window. In the Inputs section, find the MyQuantumTradingEmail input and enter here the email address you used at the Quantum Trading Shop to activate the indicator. PLEASE MAKE SURE TO ENCLOSE THE EMAIL ADDRESS IN DOUBLE QUOTATION MARKS. (example: “myemailaddress@gmail.com”)
Click OK (and Close) to save and go back to RadarScreen. Please note that you need to do this only once which means you do not need to input your email address again when running Quantum Trading indicators next time.
Compatible symbols in RadarScreen
The indicator works with currency pairs that belong to the combination of the 8 major currencies which are USD, EUR, GBP, CHF, JPY, CAD, AUD and NZD.
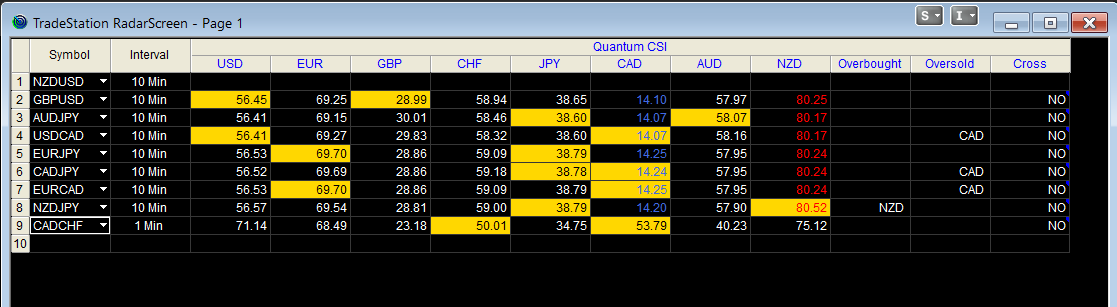
RadarScreen columns
USD
Displays the current value of the US Dollar in the Quantum CSI
EUR
Displays the current value of the Euro in the Quantum CSI
GBP
Displays the current value of the British Pound in the Quantum CSI
CHF
Displays the current value of the Swiss Franc in the Quantum CSI
JPY
Displays the current value of the Japanese Yen in the Quantum CSI
CAD
Displays the current value of the Canadian Dollar in the Quantum CSI
AUD
Displays the current value of the Australian Dollar in the Quantum CSI
NZD
Displays the current value of the New Zealand Dolar in the Quantum CSI
Overbought
Displays the currency(ies) in the pair that are overbought
Oversold
Displays the currency(ies) in the pair that are oversold
Cross
Displays YES if the currency pair crossed each other in the Quantum CSI, otherwise it displays NO
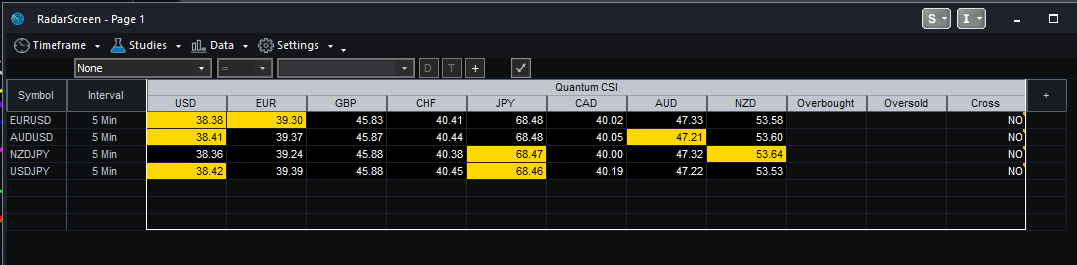
Color changes in the RadarScreen
The cell’s background and text color may change on certain conditions.
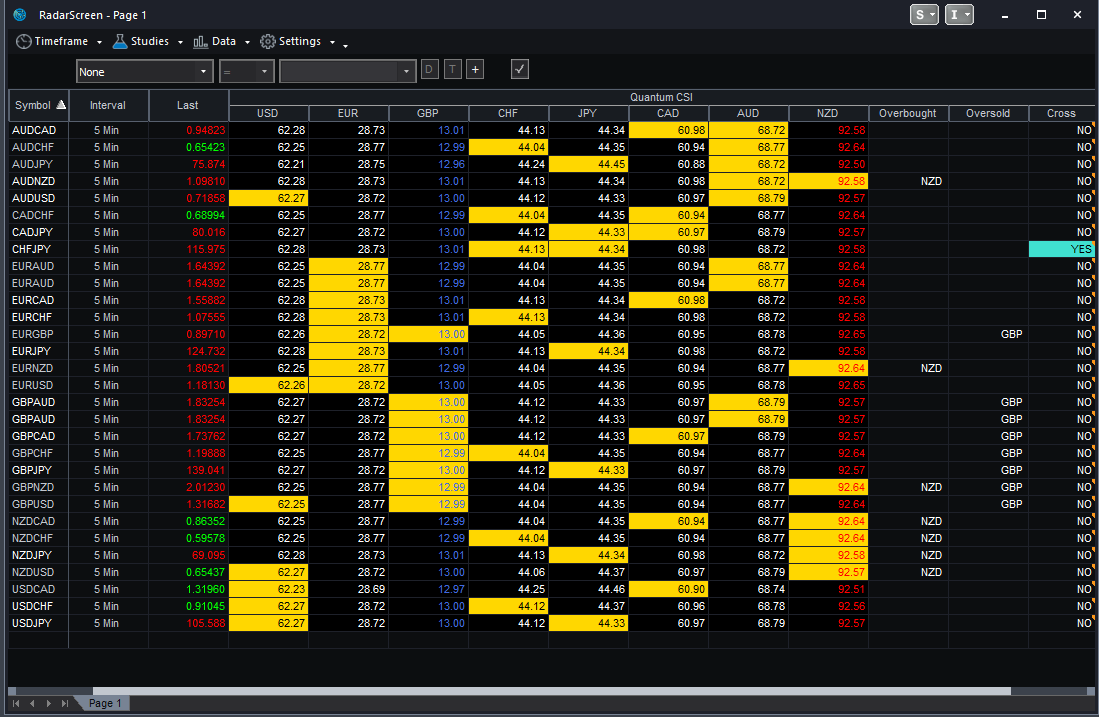
Cell background color changes
- Currency columns turn Yellow if it is part of the current currency pair
- There are 2 yellow cells for each valid row
- The Cross column changes to Teal when its value is YES
Cell text color changes
- Blue if the currency is OVERSOLD
- Red if the currency is OVERBOUGHT
Removing the indicator from RadarScreen
From the RadarScreen window’s toolbar, please click Studies > Edit Study… > All Studies… then select/click Quantum CSI in the list at right hand side of the window. Click the “<- Remove” button then click OK to close the window.
Using the indicator in TradeStation Global
Applying the indicator to a Chart Analysis window
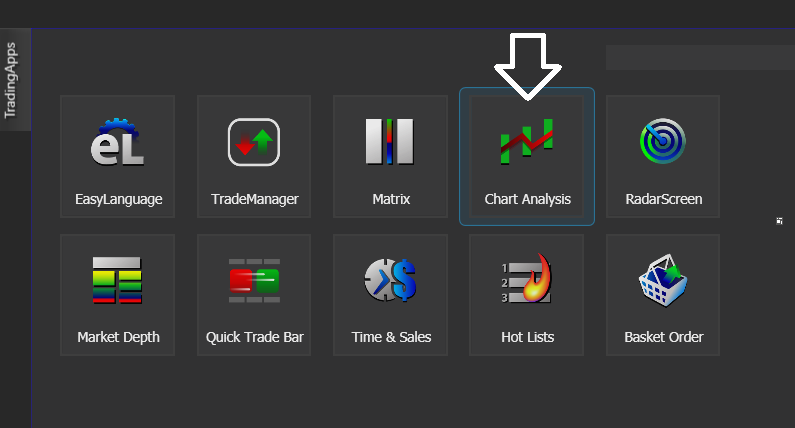
From the Apps menu of your TradeStation platform, please open a Chart Analysis window.
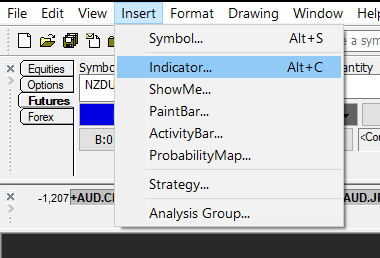
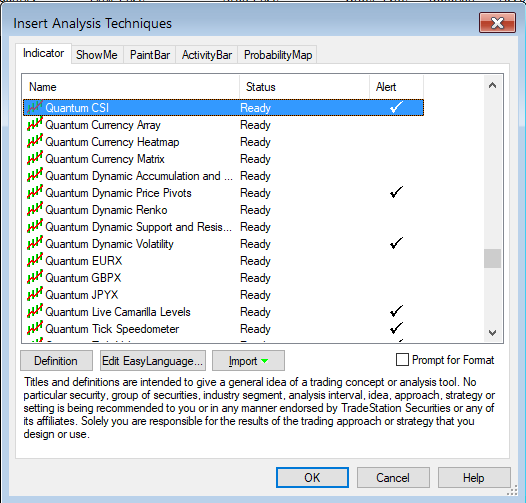
From the menu bar, click Insert > Indicator… > Indicator tab then scroll down at the list and select the Quantum CSI and click OK to apply the indicator in the chart.
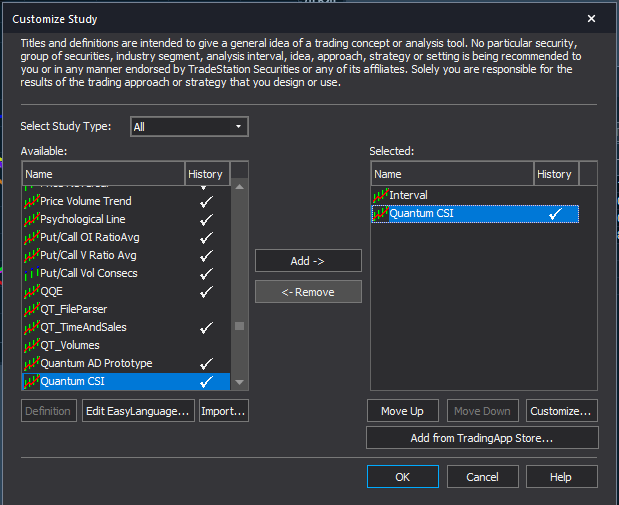
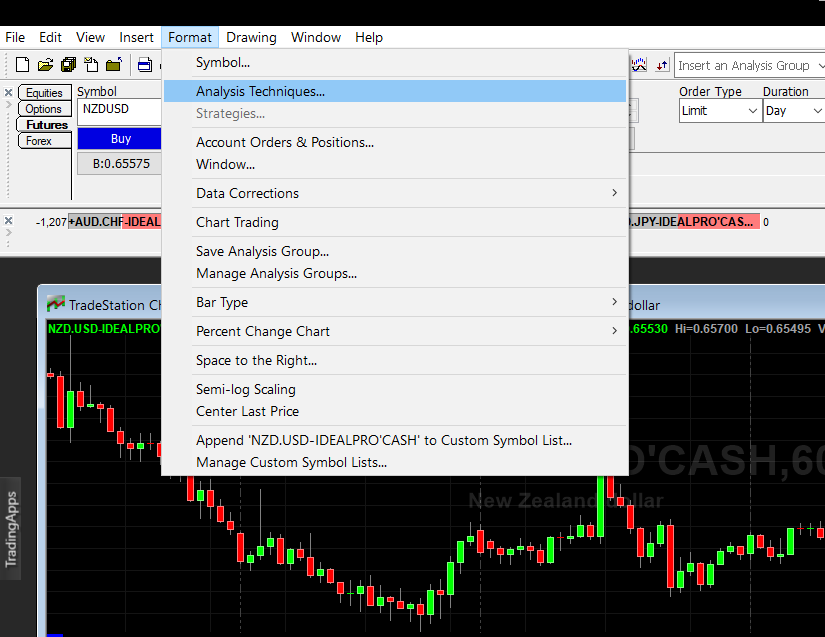
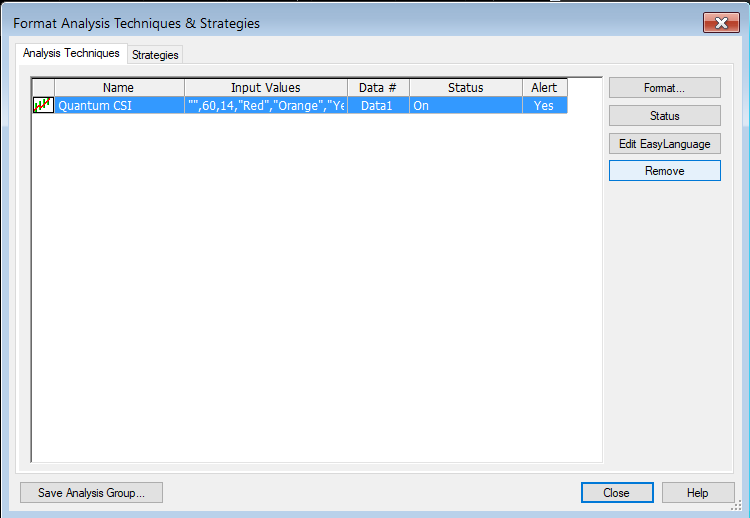
IMPORTANT: If this is your first time to run Quantum Trading indicators, the indicator will not work until you input your email address in its settings. To do this, please go back to your Chart Analysis window then in the menu bar, click Format > Analysis Techniques…
Select the indicator from the list then turn it On by clicking the Status button at the right hand side of the window. Click Format… or double-click the Quantum CSI to open the Format Indicator window. In the Inputs section, find the MyQuantumTradingEmail input and enter here the email address you used at the Quantum Trading Shop to activate the indicator. PLEASE MAKE SURE TO ENCLOSE THE EMAIL ADDRESS IN DOUBLE QUOTATION MARKS. (example: “myemailaddress@gmail.com”)
Click OK (and Close) to save and go back to your chart. Please note that you need to do this only once which means you do not need to input your email address again when running Quantum Trading indicators next time.
Customizing the indicator in Chart Analysis
Inputs
- MyQuantumTradingEmail – When running the indicator for the first time in your TradeStation trading account, you need to enter the email address you used to purchase the indicator in the Quantum Trading Shop as part of its verification process. You need to do this only once as the indicators “remember” your email address by storing it in the local drive. Please make sure that you enter your email address correctly and exactly without any extra spaces before and after it. If you made an error, simply fill this input again to update it. This is a string input which requires you to enclose your email address in double quotation marks (“”).
- LookBack – The CSI requires a significant amount of processing power compared to most indicators and this input limits it to calculate the last 60 bars by default. The higher the value of this input is, the more processing power is required, although you can change this if you wish to extend its coverage in the bar history.
- RSIPeriod – This setting is used to “fine tune” the internal RSI indicator of the Currency Strength Indicator. Increasing the value makes the indicator less responsive to price movement, thus the steepness of the curves decrease. A higher RSI Period also means that currencies are less likely to cross the 80 and 20 lines. Conversely, decreasing it, makes the indicator more responsive to price movement, thus the steepness of the curves increase. A lower RSI Period also means that currencies are more likely to cross the 80 and 20 lines and also stay there for longer periods of time. The recommended settings are between a minimum of 7 and a maximum of 14. For medium to longer term trading approaches then the higher RSI Period is recommended (towards 14 or the default), whilst for faster scalping trading approaches, then a lower RSI Period can be applied (towards 7).
- ColorUSD, ColorEUR, ColorGBP, ColorCHF, ColorJPY, ColorCAD, ColorAUD, ColorNZD – These inputs define the colors of the Quantum CSI with their respective currency. These changes both the color of the line and its corresponding currency label. They are also string inputs which means you need to enclose the name color in double quotation marks (“”). Named colors are the only accepted values in these inputs which are all listed in the following link –
http://help.tradestation.com/09_01/tsdevhelp/Subsystems/elobject/class_win/color_class.htm
The color of a line reverts to the default named color if the input’s value is invalid. - DetectCrosses – A currency cross happens when one currency line intersects with another which indicates a significant price action between the two currencies, and signals the development of a trend which is already in place. This input makes sure that the indicator checks for crosses at each calculation when Alerts are enabled. Its value can either be true or false.
- DetectOverBoughtOverSold – A currency is said to be overbought or oversold when its line in the Quantum CSI crosses the 80 or 20 level respectively. This input makes sure that the indicator checks for overbought and oversold currencies as they happen when Alerts are enabled.
- Identifier – We strongly advise changing the value of this Input when running 2 (or more) instances of the Quantum CSI in the same chart. By changing the value of the Identifier input, it allows the indicator to store different combinations of visible currency lines in each instance of the Quantum CSI.
General
You can modify the name, short name, notes, maximum number of bars the indicator will reference, and more. We do not recommend changing any of the settings in this section but you can learn more about the different options in the General tab in TradeStation’s help guide at the link below.
Alerts
This section controls the alert functions of the indicator. Alerts are enabled in the indicator by default but please note that the Quantum CSI allows you to choose which kind of messages you like to be alerted to you when they trigger. Please see the DetectCrosses and DetectOverBoughtOverSold inputs in the Inputs section for more details.
You can learn more about the different options in the Alerts tab in TradeStation’s help guide at the link below.
Style
You can change the properties of the plot lines in this section such as the weight (thickness) and style of each line.
You can learn more about the different options in the Style tab in TradeStation’s help guide at the link below.
Color
We do not recommend changing the colors of the indicator in this section. Instead, please use the “Color…” inputs defined in its Inputs to safely change the color of each currency.
You can learn more about the different options in the Color tab in TradeStation’s help guide at the link below.
Scaling
The Scaling tab is used to modify the scaling settings for the y-axis of the indicator in the active Chart Analysis window. We do not recommend changing any of the settings in this section but you can learn more about the different options in the Scaling tab in TradeStation’s help guide at the link below.
Advanced
The Advanced tab allows you to set advanced preferences for the indicator. We do not recommend changing any of the settings in this section but you can learn more about the different options in the Advanced tab in TradeStation’s help guide at the link below.
Making adjustments to the user interface in Chart Analysis
Currency Buttons
The currency buttons are the colored text enclosed in square brackets located at the left hand side of the indicator. Please note that you need to extend the border of the indicator vertically to reveal the currency buttons. Please see the section below for more details.
Each button corresponds to one of the lines in the indicator that matches its color. Clicking a button toggles the visibility of the line it corresponds to. A button can be one of 2 states: NOT PRESSED or PRESSED. A button is pressed when the square brackets around it turns to dashes.
For example: [USD] is not pressed while –USD– is pressed.
- If the button is NOT PRESSED, the corresponding currency line is visible in the CSI. In this state, the button has square brackets around it.
- If the button IS PRESSED, the corresponding currency line is hidden. In this state, the button has dashes around it.
This way, you can easily focus on a currency or group of currencies conveniently. Also, your toggled buttons are saved for each timeframe so you can be sure that the same buttons are pressed when you reopen your TradeStation client.
Expanding the Indicator’s Screen Size
Follow the steps below to expand the Quantum CSI’s screen size in the chart.
- Hover your mouse pointer over the space between the Quantum CSI and the chart above it until the mouse cursor changes into a double headed arrow
- HOLD down the left click on your mouse, and drag the mouse to the top until all currency buttons are visible
- Hover your mouse over the right hand edge of the chart until a double headed arrow appears
- HOLD down the left click on your mouse, and drag the right hand edge of the chart across to the left and release when done
- Click on the chart to make it the active window
- Click on the Increase Bar Spacing icon in the toolbar, to expand your indicator to full size.
Removing the indicator from the Chart Analysis window
From the menu bar of your TradeStation platform, click Format > Analysis Techniques…
In the Analysis Techniques tab, select Quantum CSI and click Remove then click Close.
Applying the indicator to RadarScreen
From the Apps menu of your TradeStation platform, please open a RadarScreen window.
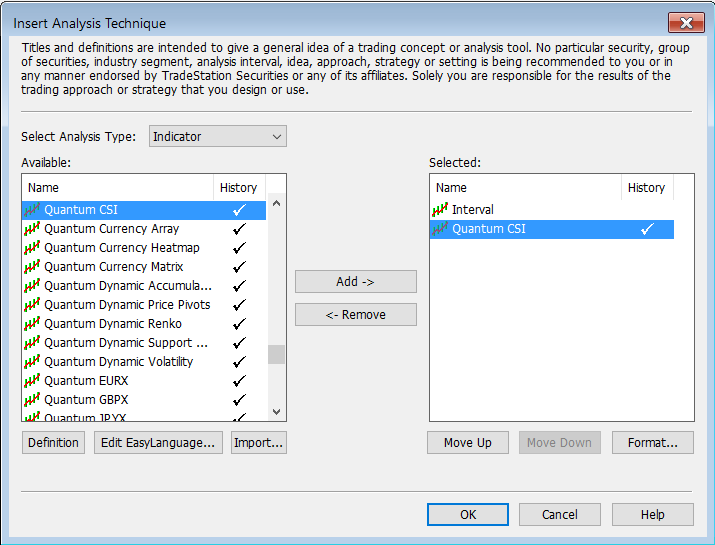
From the menu bar, click Insert > Indicator… > Indicator tab then scroll down at the indicators list at the left hand side and select the Quantum CSI. Click the Add -> button to apply the indicator in the RadarScreen. You can change the order of the indicators by clicking the Move up and Move down buttons while the indicator is selected in the list at the right hand side.
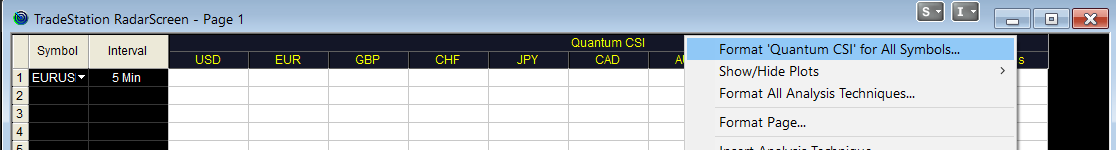
IMPORTANT: If this is your first time to run Quantum Trading indicators, the indicator will not work until you input your email address in its settings. To do this, please go back to your RadarScreen window and right-click the Quantum CSI’s column header then select Format ‘Quantum CSI’ for all Symbols…
In the Inputs tab, find the MyQuantumTradingEmail input and enter here the email address you used at the Quantum Trading Shop to activate the indicator. PLEASE MAKE SURE TO ENCLOSE THE EMAIL ADDRESS IN DOUBLE QUOTATION MARKS. (example: “myemailaddress@gmail.com”)
Click OK to save and go back to RadarScreen. Please note that you need to do this only once which means you do not need to input your email address again when running Quantum Trading indicators next time.
Compatible symbols in RadarScreen
The indicator works with currency pairs that belong to the combination of the 8 major currencies which are USD, EUR, GBP, CHF, JPY, CAD, AUD and NZD.
RadarScreen columns
USD
Displays the current value of the US Dollar in the Quantum CSI
EUR
Displays the current value of the Euro in the Quantum CSI
GBP
Displays the current value of the British Pound in the Quantum CSI
CHF
Displays the current value of the Swiss Franc in the Quantum CSI
JPY
Displays the current value of the Japanese Yen in the Quantum CSI
CAD
Displays the current value of the Canadian Dollar in the Quantum CSI
AUD
Displays the current value of the Australian Dollar in the Quantum CSI
NZD
Displays the current value of the New Zealand Dolar in the Quantum CSI
Overbought
Displays the currency(ies) in the pair that are overbought
Oversold
Displays the currency(ies) in the pair that are oversold
Cross
Displays YES if the currency pair crossed each other in the Quantum CSI, otherwise it displays NO
Color changes in the RadarScreen
The cell’s background and text color may change on certain conditions.
Cell background color changes
- Currency columns turn Yellow if it is part of the current currency pair
- There are 2 yellow cells for each valid row
- The Cross column changes to Teal when its value is YES
Cell text color changes
- Blue if the currency is OVERSOLD
- Red if the currency is OVERBOUGHT
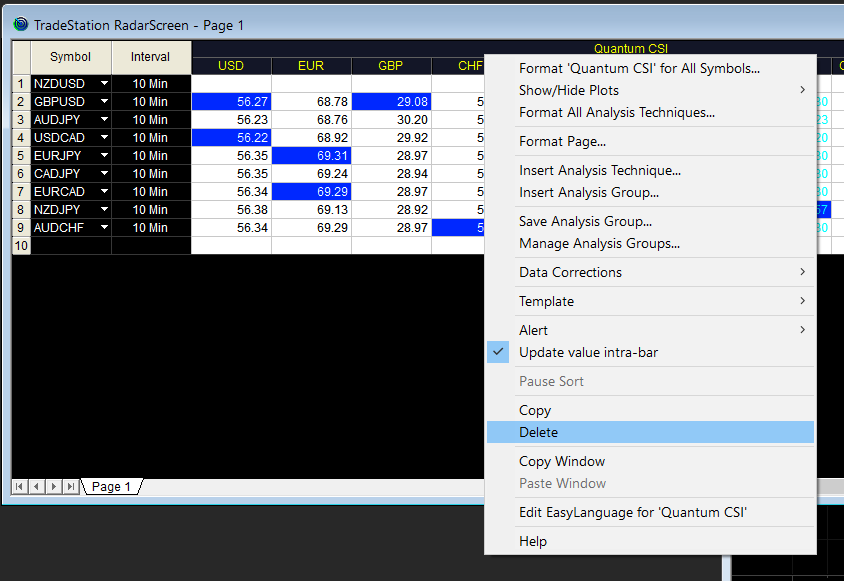
Removing the indicator from RadarScreen
From the RadarScreen window, right-click the Quantum CSI’s column header then select Delete.