
Overview Of The USDX Indicator
The Quantum USDX has been created to provide a more “balanced” view of the US dollar, more representative if you like of the world today. It has a basket of four currencies which are equally weighted, in the same way as with the Quantum JPYX indicator. These are as follows:
- Euro
- British Pound
- Japanese Yen
- Australian dollar
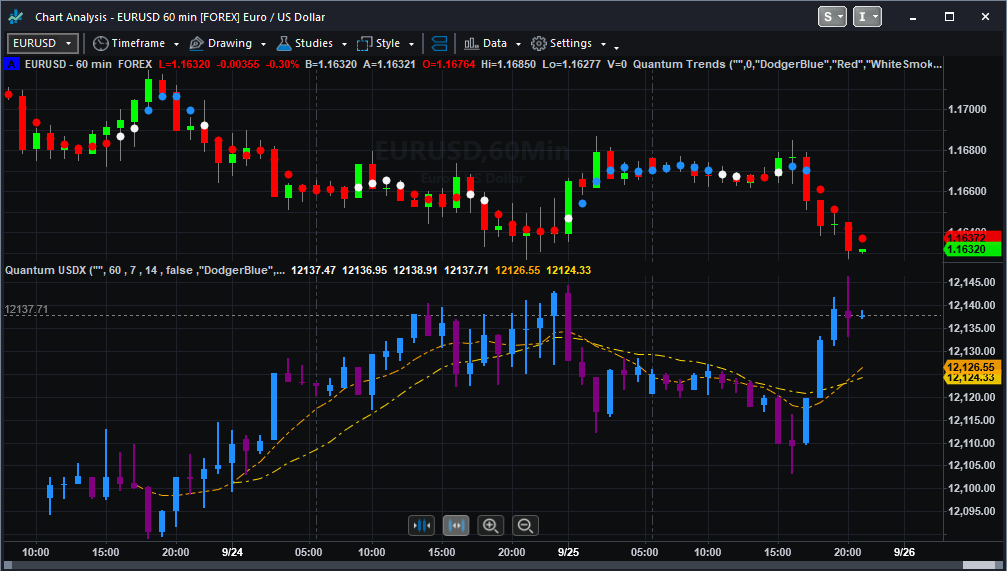
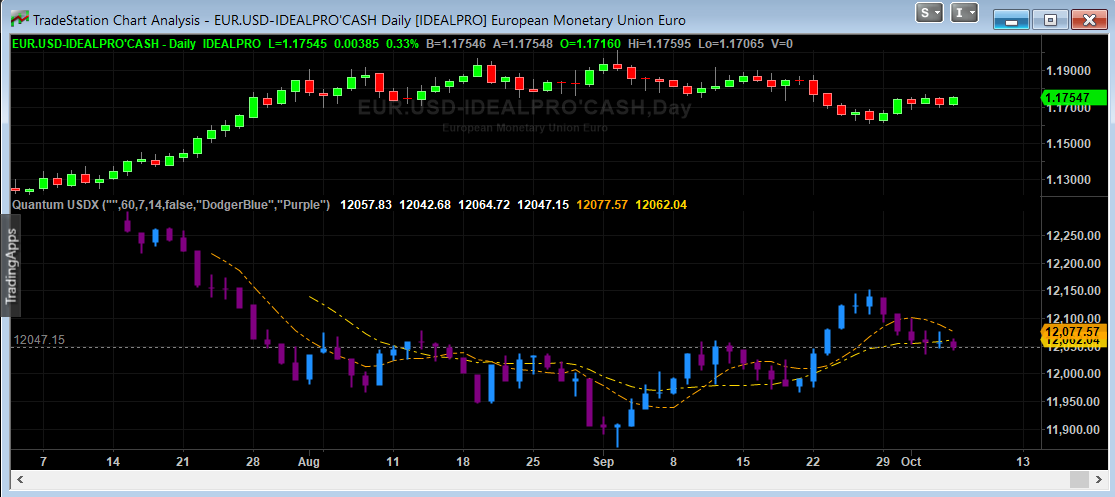
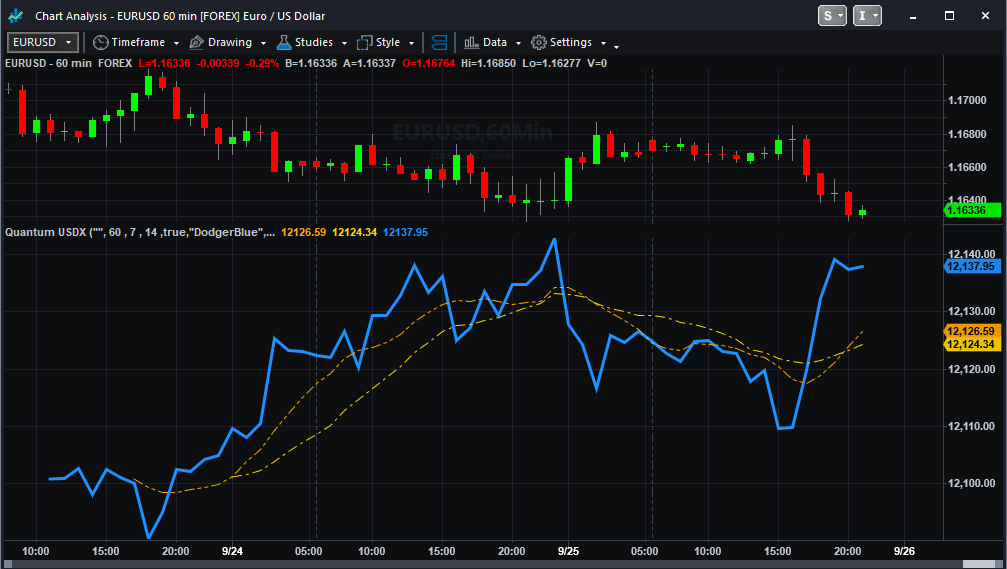
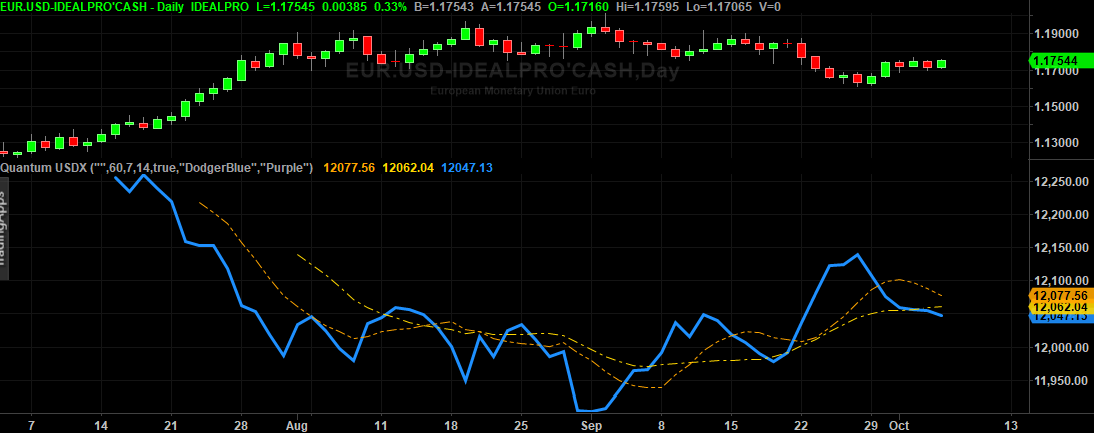
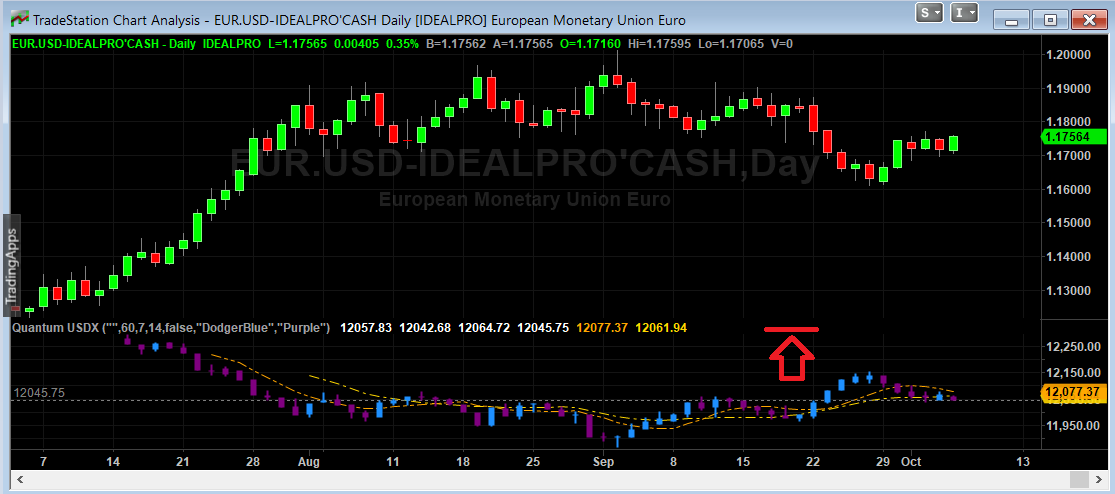
The Quantum USDX indicator displays strength and weakness in the US dollar against this basket of currencies. It can be applied to any chart in any timeframe, and will give you an instant view of the US dollar. Alternatively, why not create a separate workspace with multiple timeframes. Observing the movement of the USDX is essential, as it provides an alternative view of price action in related markets such as gold, oil, and agricultural commodities.
The indicator can be used in one of three ways:
- First, as an inverse indicator to a major currency pair, helping you get in, stay in, and get out
- Second as a confirming indicator for the Quantum Currency Strength Indicator, providing a perspective against other currencies
- Finally, as the ultimate barometer of risk as a safe haven currency as the currency of first reserve
Whichever approach you adopt you will no longer have to leave your TradeStation platform for a view of the US dollar! How cool is that!
Using the indicator in TradeStation Securities
Applying the indicator to a Chart Analysis window
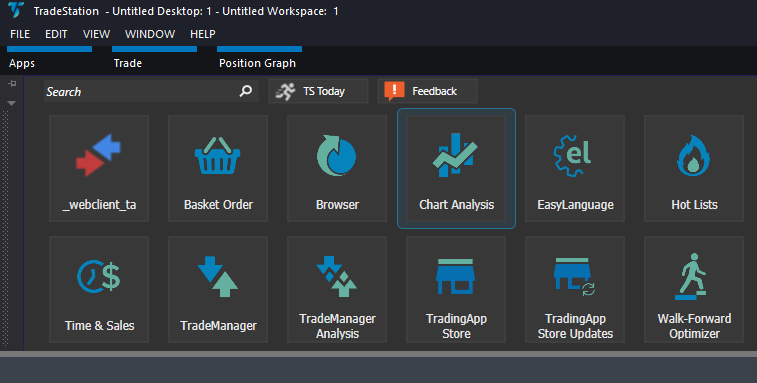
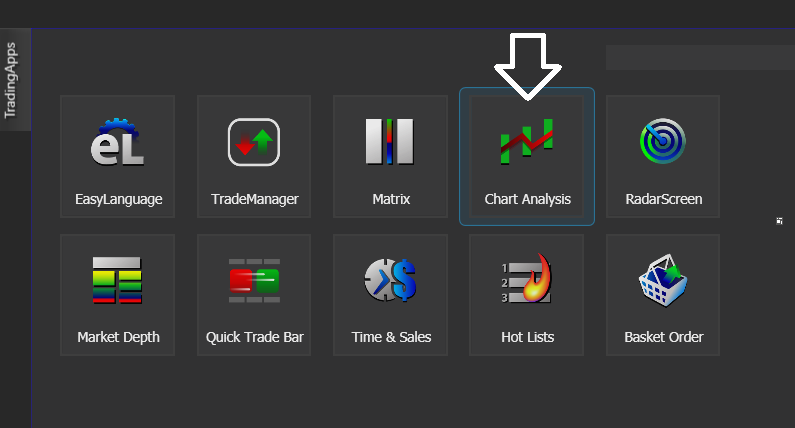
From the Apps menu of your TradeStation platform, please open a Chart Analysis window.
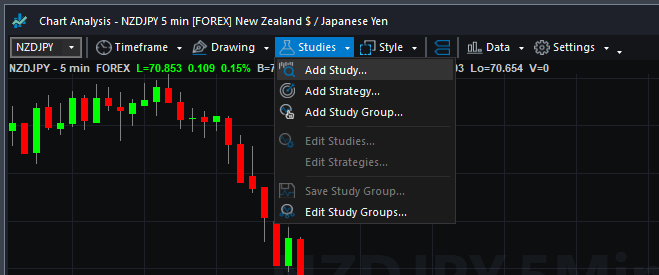
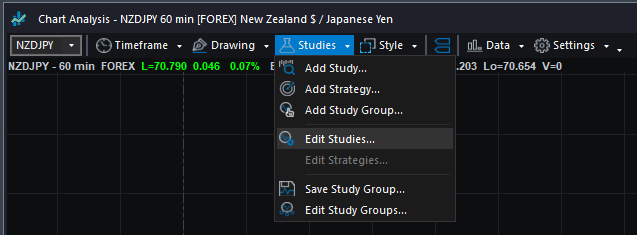
From the Chart Analysis window’s toolbar, please click Studies > Add Study…
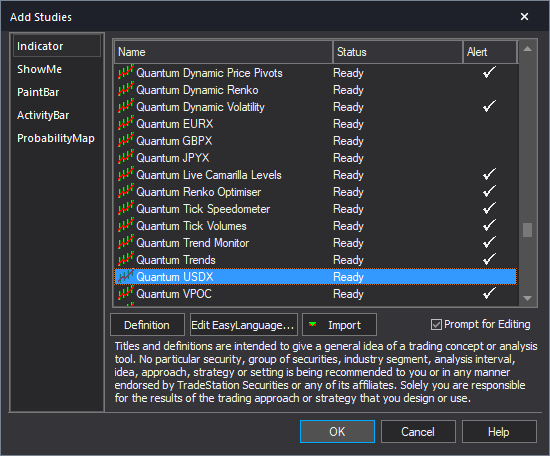
From the Add Study window, please choose Indicator at the left hand side of the interface then at the right, scroll down and select Quantum USDX. Click OK to apply the indicator to the chart.
IMPORTANT: If this is your first time to run Quantum Trading indicators, the indicator will not work until you input your email address in its settings. To do this, please go back to your Chart Analysis window and click Studies > Edit Studies…
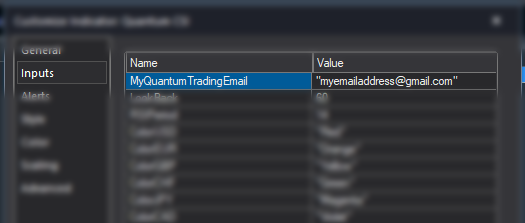
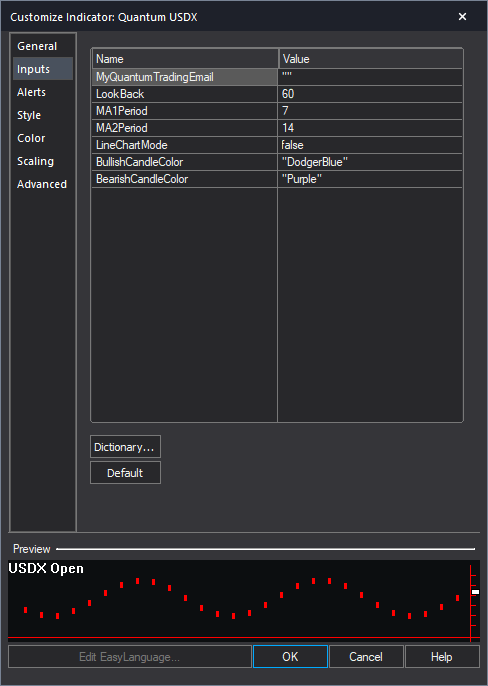
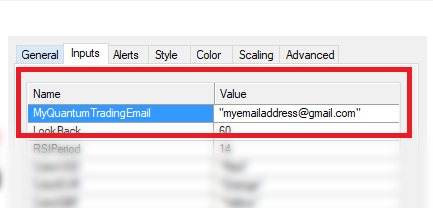
Select the indicator from the list then turn it On by clicking the Status button at the right hand side of the window. Click Customize… or double-click the Quantum USDX to open the Customize Indicator window. In the Inputs section, find the MyQuantumTradingEmail input and enter here the email address you used at the Quantum Trading Shop to activate the indicator. PLEASE MAKE SURE TO ENCLOSE THE EMAIL ADDRESS IN DOUBLE QUOTATION MARKS. (example: “myemailaddress@gmail.com”)
Click OK (and Close) to save and go back to your chart. Please note that you need to do this only once which means you do not need to input your email address again when running Quantum Trading indicators next time.
Customizing the indicator in Chart Analysis
Inputs
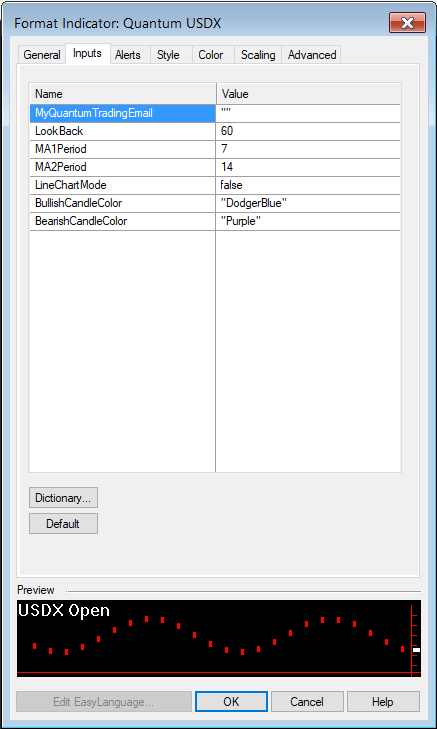
- MyQuantumTradingEmail – When running the indicator for the first time in your TradeStation trading account, you need to enter the email address you used to purchase the indicator in the Quantum Trading Shop as part of its verification process. You need to do this only once as the indicators “remember” your email address by storing it in the local drive. Please make sure that you enter your email address correctly and exactly without any extra spaces before and after it. If you made an error, simply fill this input again to update it. This is a string input which requires you to enclose your email address in double quotation marks (“”).
- LookBack – The Quantum USDX processes data from different sources unlike most indicators and this input helps improve load times by limiting the number of bars it calculates. You can increase this input to lengthen the period of the index calculated.
- MA1Period – This is the length of the first Simple Moving Average included in the indicator with a default setting of 7.
- MA2Period – This is the length of the second Simple Moving Average included in the indicator with a default setting of 14.
- LineChartMode – The Quantum USDX indicator attempts to generate its own candlestick chart by default but if this field is set to true, it will use a line chart to display the index.
- BullishCandleColor – This setting allows you to change the color of the bullish candlesticks. As a string input, you need to enclose the name color in double quotation marks (“”). Named colors are the only accepted values in these inputs which are all listed in the following link – http://help.tradestation.com/09_01/tsdevhelp/Subsystems/elobject/class_win/color_class.htm. The color of a line reverts to the default named color if the input’s value is invalid.
- BearishCandleColor – This setting allows you to change the color of the bearish candlesticks. As a string input, you need to enclose the name color in double quotation marks (“”). Named colors are the only accepted values in these inputs which are all listed in the following link – http://help.tradestation.com/09_01/tsdevhelp/Subsystems/elobject/class_win/color_class.htm. The color of a line reverts to the default named color if the input’s value is invalid.
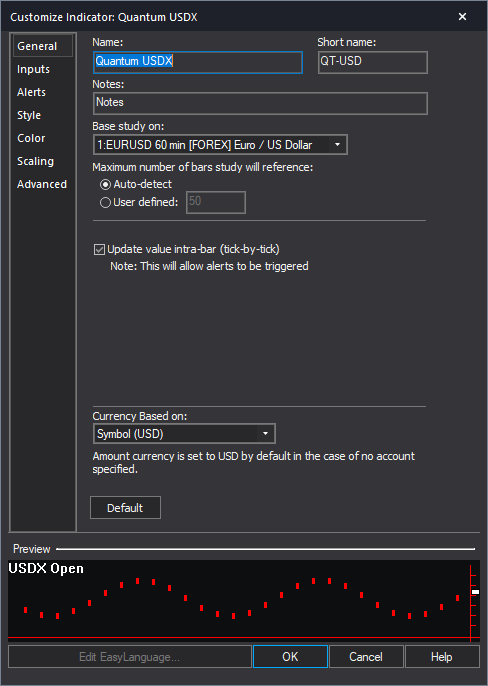
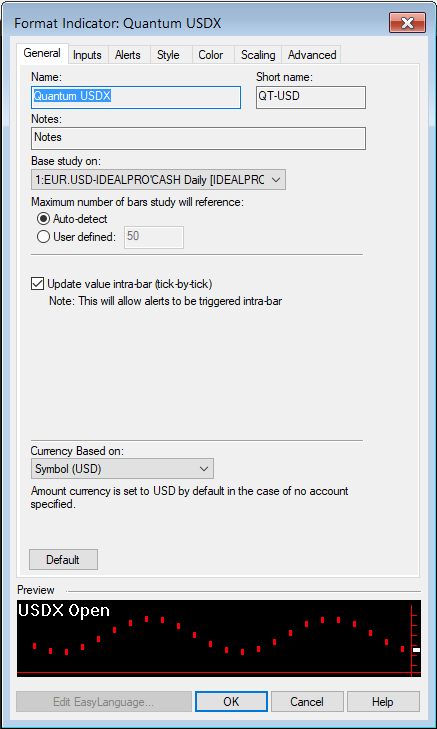
General
You can modify the name, short name, notes, maximum number of bars the indicator will reference, and more. We do not recommend changing any of the settings in this section but you can learn more about the different options in the General tab in TradeStation’s help guide at the link below.
http://help.tradestation.com/10_00/eng/tradestationhelp/study/customize_study_general.htm
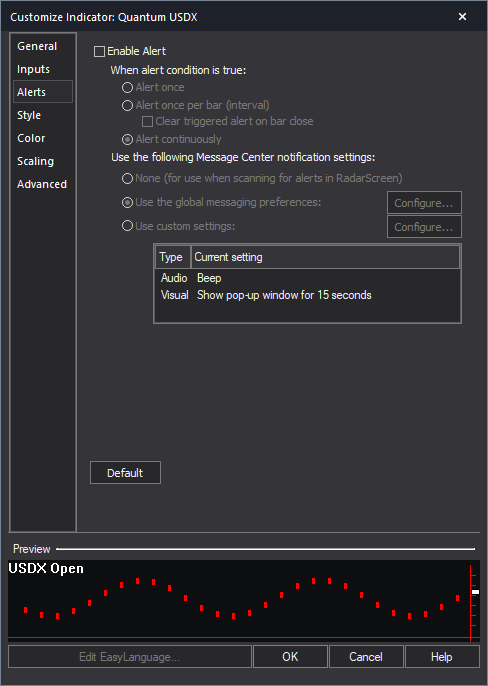
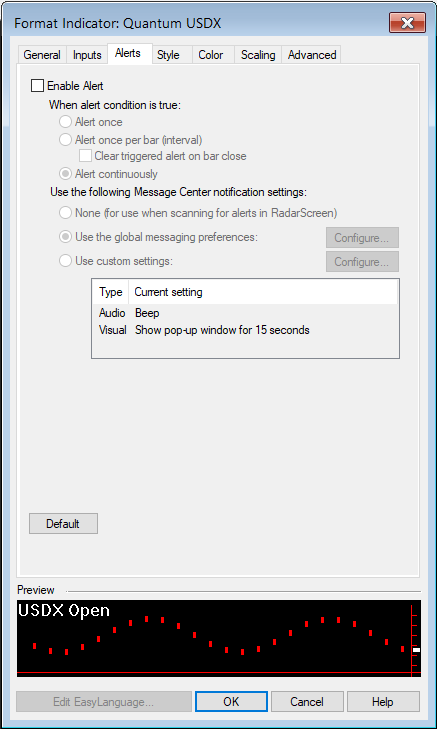
Alerts
The Quantum USDX indicator does not trigger any alerts.
You can learn more about the different options in the Alerts tab in TradeStation’s help guide at the link below.
http://help.tradestation.com/10_00/eng/tradestationhelp/study/customize_study_alerts.htm
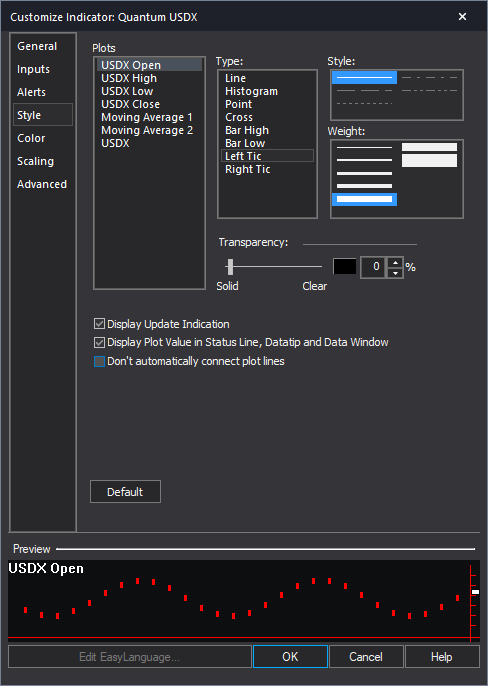
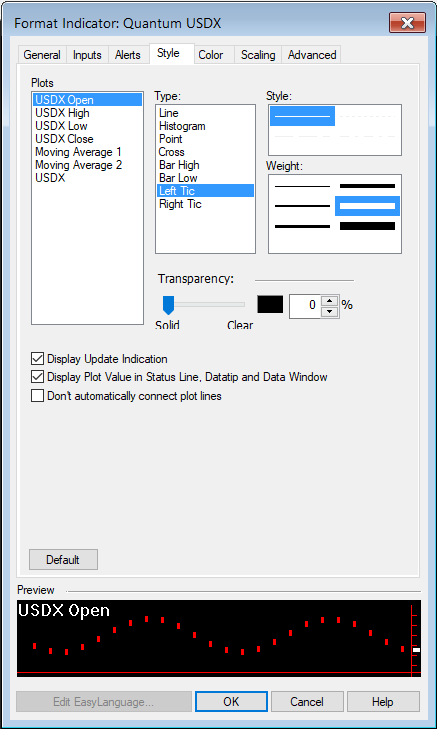
Style
The indicator uses 3 plots which you can customize the style in this section: Moving Average 1, Moving Average 2 and USDX. The USDX plot is displayed only when the indicator is in Line Chart Mode.
You can learn more about the different options in the Style tab in TradeStation’s help guide at the link below.
http://help.tradestation.com/10_00/eng/tradestationhelp/study/customize_study_style.htm
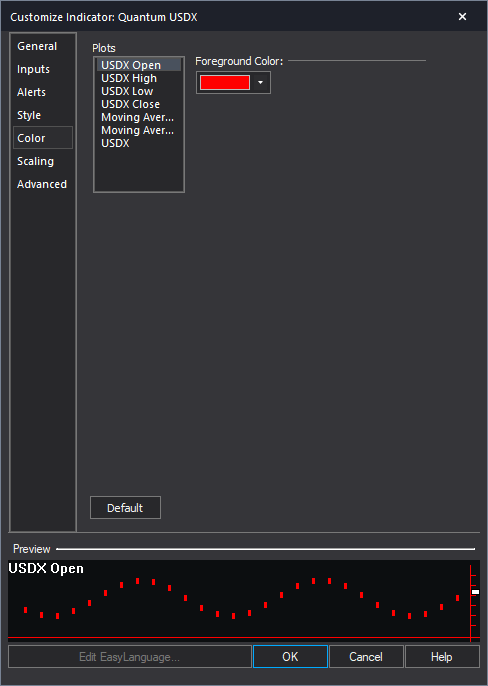
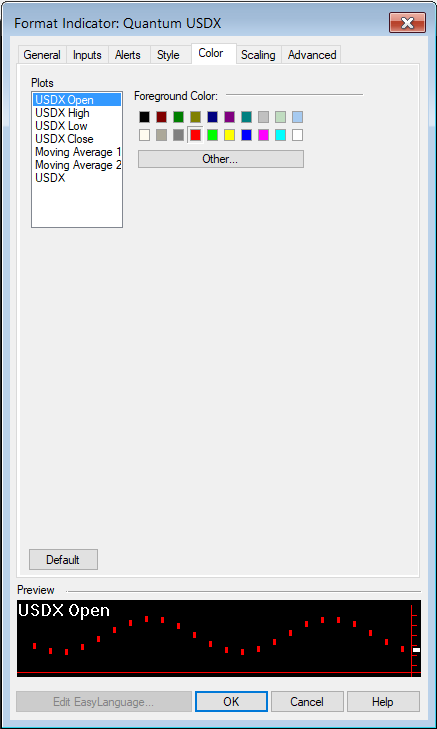
Color
The indicator uses 3 plots which you can change the color in this section: Moving Average 1, Moving Average 2 and USDX. The USDX plot is displayed only when the indicator is in Line Chart Mode. To change the color of the candlesticks please use the BullishCandleColor and BearishCandleColor variables found in the indicator Inputs.
You can learn more about the different options in the Color tab in TradeStation’s help guide at the link below.
http://help.tradestation.com/10_00/eng/tradestationhelp/study/customize_study_color.htm
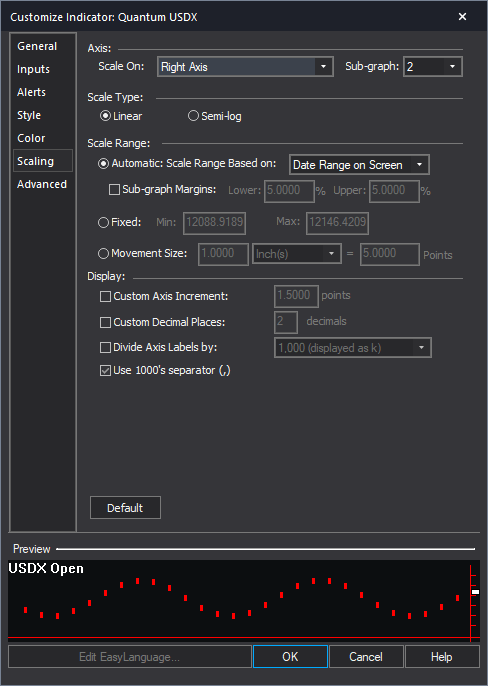
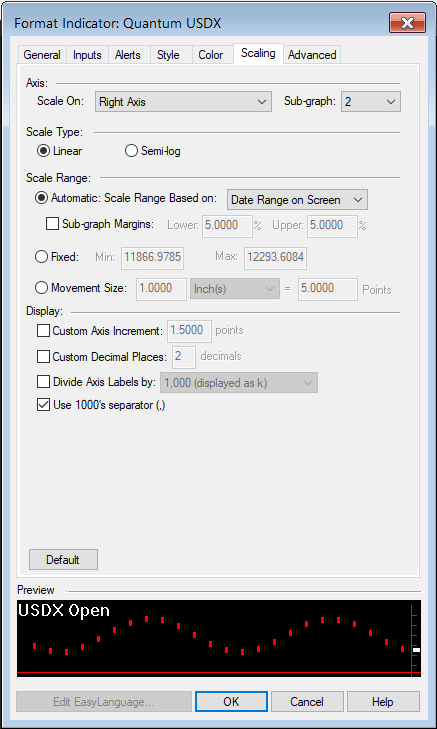
Scaling
The Scaling tab is used to modify the scaling settings for the y-axis of the indicator in the active Chart Analysis window. We do not recommend changing any of the settings in this section but you can learn more about the different options in the Scaling tab in TradeStation’s help guide at the link below.
http://help.tradestation.com/10_00/eng/tradestationhelp/study/customize_study_scaling.htm
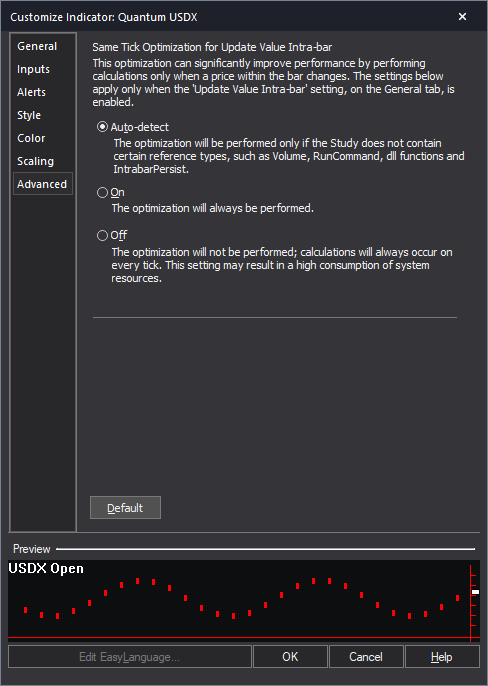
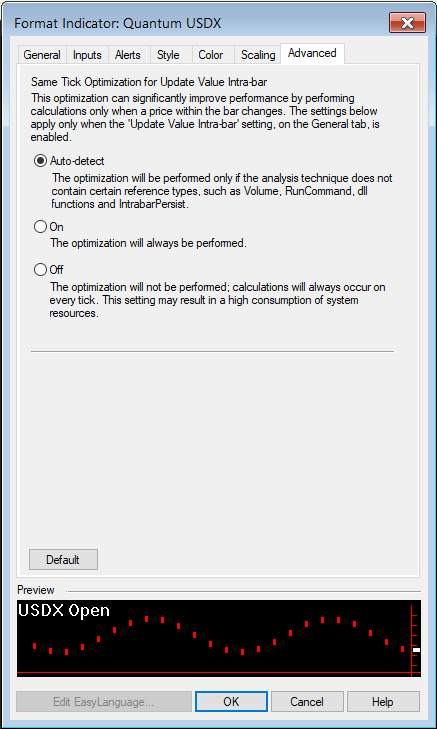
Advanced
The Advanced tab allows you to set advanced preferences for the indicator. We do not recommend changing any of the settings in this section but you can learn more about the different options in the Advanced tab in TradeStation’s help guide at the link below.
http://help.tradestation.com/10_00/eng/tradestationhelp/study/customize_study_advanced.htm
Making adjustments to the user interface in Chart Analysis
Expanding the Indicator’s Screen Size
Follow the steps below to expand the Quantum USDX’s screen size in the chart.
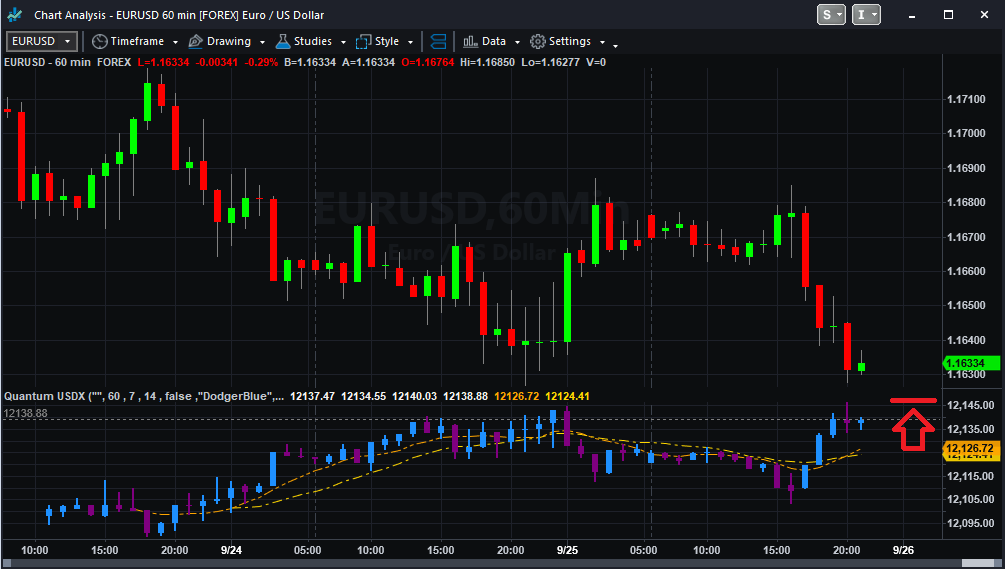
- Hover your mouse pointer over the space between the Quantum USDX and the chart above it until the mouse cursor changes into a double headed arrow
- HOLD down the left click on your mouse, and drag the mouse to the top until all currency buttons are visible
- Hover your mouse over the right hand edge of the chart until a double headed arrow appears
- HOLD down the left click on your mouse, and drag the right hand edge of the chart across to the left and release when done
- Click on the chart to make it the active window
- Click on the Increase Spacing – Up Arrow icon below, to expand your indicator to full size. The Increase Spacing – Up Arrow button is shown below when you hover over the bottom portion of the chart window.
Removing the indicator from the Chart Analysis window
From the Chart Analysis window’s toolbar, please click Studies > Edit Studies…
In the Studies tab, select Quantum USDX and click Remove then click Close.
RadarScreen
The Quantum USDX is not built for the RadarScreen app.
Using the indicator in TradeStation Global
Applying the indicator to a Chart Analysis window
From the Apps menu of your TradeStation platform, please open a Chart Analysis window.
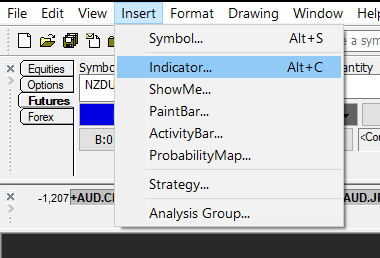
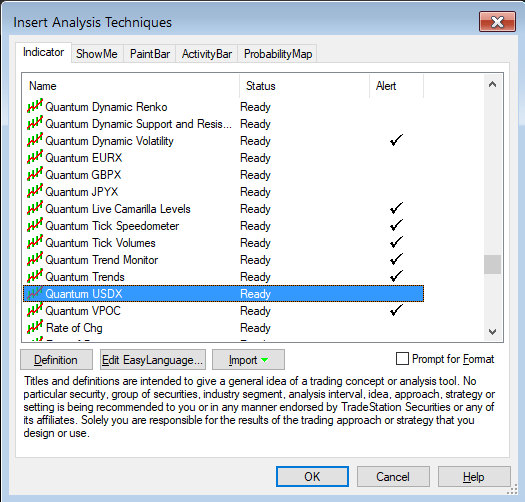
From the menu bar, click Insert > Indicator… > Indicator tab then scroll down at the list and select the Quantum USDX and click OK to apply the indicator in the chart.
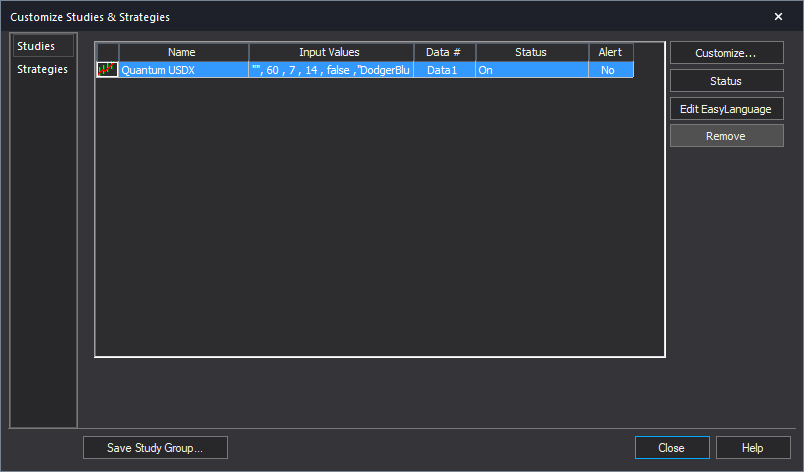
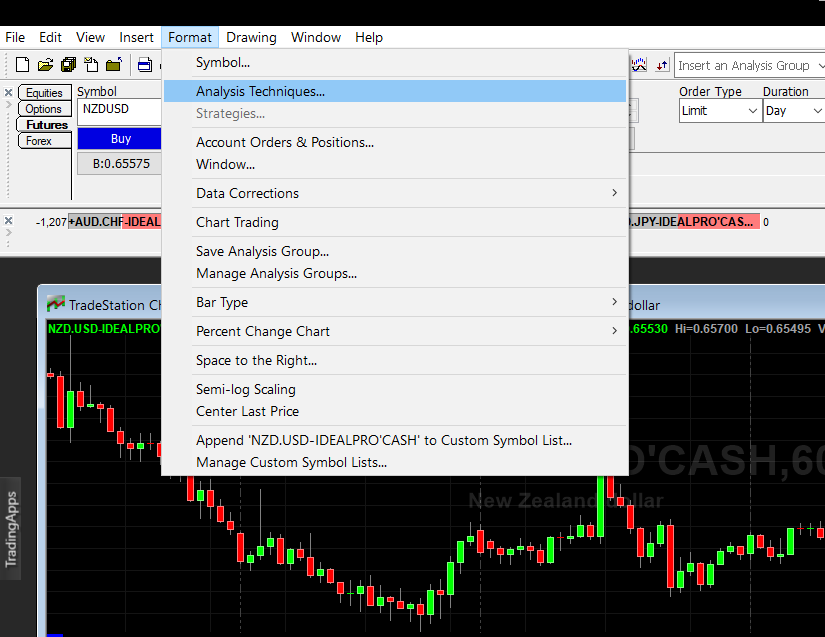
IMPORTANT: If this is your first time to run Quantum Trading indicators, the indicator will not work until you input your email address in its settings. To do this, please go back to your Chart Analysis window then in the menu bar, click Format > Analysis Techniques…
Select the indicator from the list then turn it On by clicking the Status button at the right hand side of the window. Click Format… or double-click the Quantum USDX to open the Format Indicator window. In the Inputs section, find the MyQuantumTradingEmail input and enter here the email address you used at the Quantum Trading Shop to activate the indicator. PLEASE MAKE SURE TO ENCLOSE THE EMAIL ADDRESS IN DOUBLE QUOTATION MARKS. (example: “myemailaddress@gmail.com”)
Click OK (and Close) to save and go back to your chart. Please note that you need to do this only once which means you do not need to input your email address again when running Quantum Trading indicators next time.
Customizing the indicator in Chart Analysis
Inputs
- MyQuantumTradingEmail – When running the indicator for the first time in your TradeStation trading account, you need to enter the email address you used to purchase the indicator in the Quantum Trading Shop as part of its verification process. You need to do this only once as the indicators “remember” your email address by storing it in the local drive. Please make sure that you enter your email address correctly and exactly without any extra spaces before and after it. If you made an error, simply fill this input again to update it. This is a string input which requires you to enclose your email address in double quotation marks (“”).
- LookBack – The Quantum USDX processes data from different sources unlike most indicators and this input helps improve load times by limiting the number of bars it calculates. You can increase this input to lengthen the period of the index calculated.
- MA1Period – This is the length of the first Simple Moving Average included in the indicator with a default setting of 7.
- MA2Period – This is the length of the second Simple Moving Average included in the indicator with a default setting of 14.
- LineChartMode – The Quantum USDX indicator attempts to generate its own candlestick chart by default but if this field is set to true, it will use a line chart to display the index.
- BullishCandleColor – This setting allows you to change the color of the bullish candlesticks. As a string input, you need to enclose the name color in double quotation marks (“”). Named colors are the only accepted values in these inputs which are all listed in the following link – http://help.tradestation.com/09_01/tsdevhelp/Subsystems/elobject/class_win/color_class.htm. The color of a line reverts to the default named color if the input’s value is invalid.
- BearishCandleColor – This setting allows you to change the color of the bearish candlesticks. As a string input, you need to enclose the name color in double quotation marks (“”). Named colors are the only accepted values in these inputs which are all listed in the following link – http://help.tradestation.com/09_01/tsdevhelp/Subsystems/elobject/class_win/color_class.htm. The color of a line reverts to the default named color if the input’s value is invalid.
General
You can modify the name, short name, notes, maximum number of bars the indicator will reference, and more. We do not recommend changing any of the settings in this section but you can learn more about the different options in the General tab in TradeStation’s help guide at the link below.
Alerts
The Quantum USDX indicator does not trigger any alerts.
You can learn more about the different options in the Alerts tab in TradeStation’s help guide at the link below.
Style
The indicator uses 3 plots which you can customize the style in this section: Moving Average 1, Moving Average 2 and USDX. The USDX plot is displayed only when the indicator is in Line Chart Mode.
You can learn more about the different options in the Style tab in TradeStation’s help guide at the link below.
Color
The indicator uses 3 plots which you can change the color in this section: Moving Average 1, Moving Average 2 and USDX. The USDX plot is displayed only when the indicator is in Line Chart Mode. To change the color of the candlesticks please use the BullishCandleColor and BearishCandleColor variables found in the indicator Inputs.
You can learn more about the different options in the Color tab in TradeStation’s help guide at the link below.
Scaling
he Scaling tab is used to modify the scaling settings for the y-axis of the indicator in the active Chart Analysis window. We do not recommend changing any of the settings in this section but you can learn more about the different options in the Scaling tab in TradeStation’s help guide at the link below.
Advanced
The Advanced tab allows you to set advanced preferences for the indicator. We do not recommend changing any of the settings in this section but you can learn more about the different options in the Advanced tab in TradeStation’s help guide at the link below.
Expanding the Indicator’s Screen Size
Follow the steps below to expand the Quantum USDX’s screen size in the chart.
- Hover your mouse pointer over the space between the Quantum USDX and the chart above it until the mouse cursor changes into a double headed arrow
- HOLD down the left click on your mouse, and drag the mouse to the top until all currency buttons are visible
- Hover your mouse over the right hand edge of the chart until a double headed arrow appears
- HOLD down the left click on your mouse, and drag the right hand edge of the chart across to the left and release when done
- Click on the chart to make it the active window
- Click on the Increase Bar Spacing icon in the toolbar, to expand your indicator to full size.
Removing the indicator from the Chart Analysis window
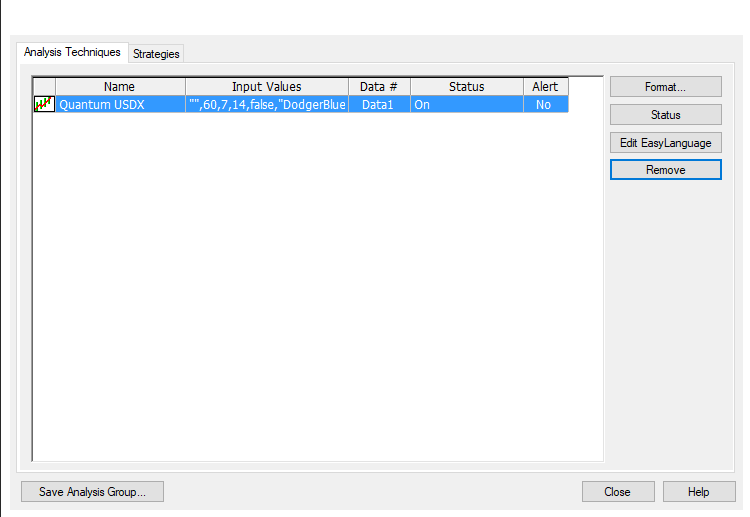
From the menu bar of your TradeStation platform, click Format > Analysis Techniques…
In the Analysis Techniques tab, select Quantum USDX and click Remove then click Close.
RadarScreen
The Quantum USDX is not built for the RadarScreen app.