Overview of The Renko Optimiser Indicator
Renko charts are one of the most popular Japanese charting techniques and there are several reasons for this.
First it allows traders to focus solely on price as the chart filters out all minor price fluctuations and market ‘noise’. This makes it easier for traders not only to identify strong moves, but also to spot significant turning points, and so allow traders to deploy smarter entries and exits.
Second, a renko chart then helps traders in what is probably one of the most difficult aspects of trading, namely staying in a position once a move is underway. The renko chart does this by displaying price momentum as it speeds up and slows down. And it does this because a renko chart is devoid of time.
And by ignoring time renko charts focus solely on price moves that meet a pre-determined value, with the chart displaying price ‘bricks’ that represent this fixed price move. The bricks are drawn at 45 degree angles from each and are usually based on the closing price for the input value. So for example if a brick is set to close once 10 pips, points or cents have gone through the market it will only do so once this value has completed.
However, there is one major disadvantage to a standard renko chart and that is traders have to manually input a value to the renko chart, and whilst experienced traders can develop a ‘feel’ for the optimum value, this can take time to develop.
After all, how do you choose the “right” value? Indeed what is the reasoning behind choosing a brick size, and is there a systematic way to pick a brick size for any situation?
And for traders who are new to the concept of Renko charts, it can be daunting and often is simply a ‘guess’ at what might be considered a ‘reasonable’ number of pips, points or cents.
And this is where the Quantum Renko Optimiser indicator for TradeStation Securities steps in, as it has been developed to offer traders all the advantages of using a renko chart with the added benefit the trader no longer has to worry about guessing the optimal setting for any instrument or market. The indicator delivers the optimal setting automatically.
So how does it work?
The Quantum Renko Optimiser indicator for Tradetation offers a simple, effective, and systematic method in choosing the most effective brick size, and the best part of all – it’s all done with just the click of a button!
By using Average True Range the Renko Optimiser indicator starts by calculating the degree of volatility of the instrument within a given period and timeframe. You may already be familiar with ATR and by using the ATR to determine the brick size, we can eliminate the noise or volatility normally present in a candlestick chart. It is a popular technique used by traders with Renko charts but which is all automated by the Renko Optimiser indicator.
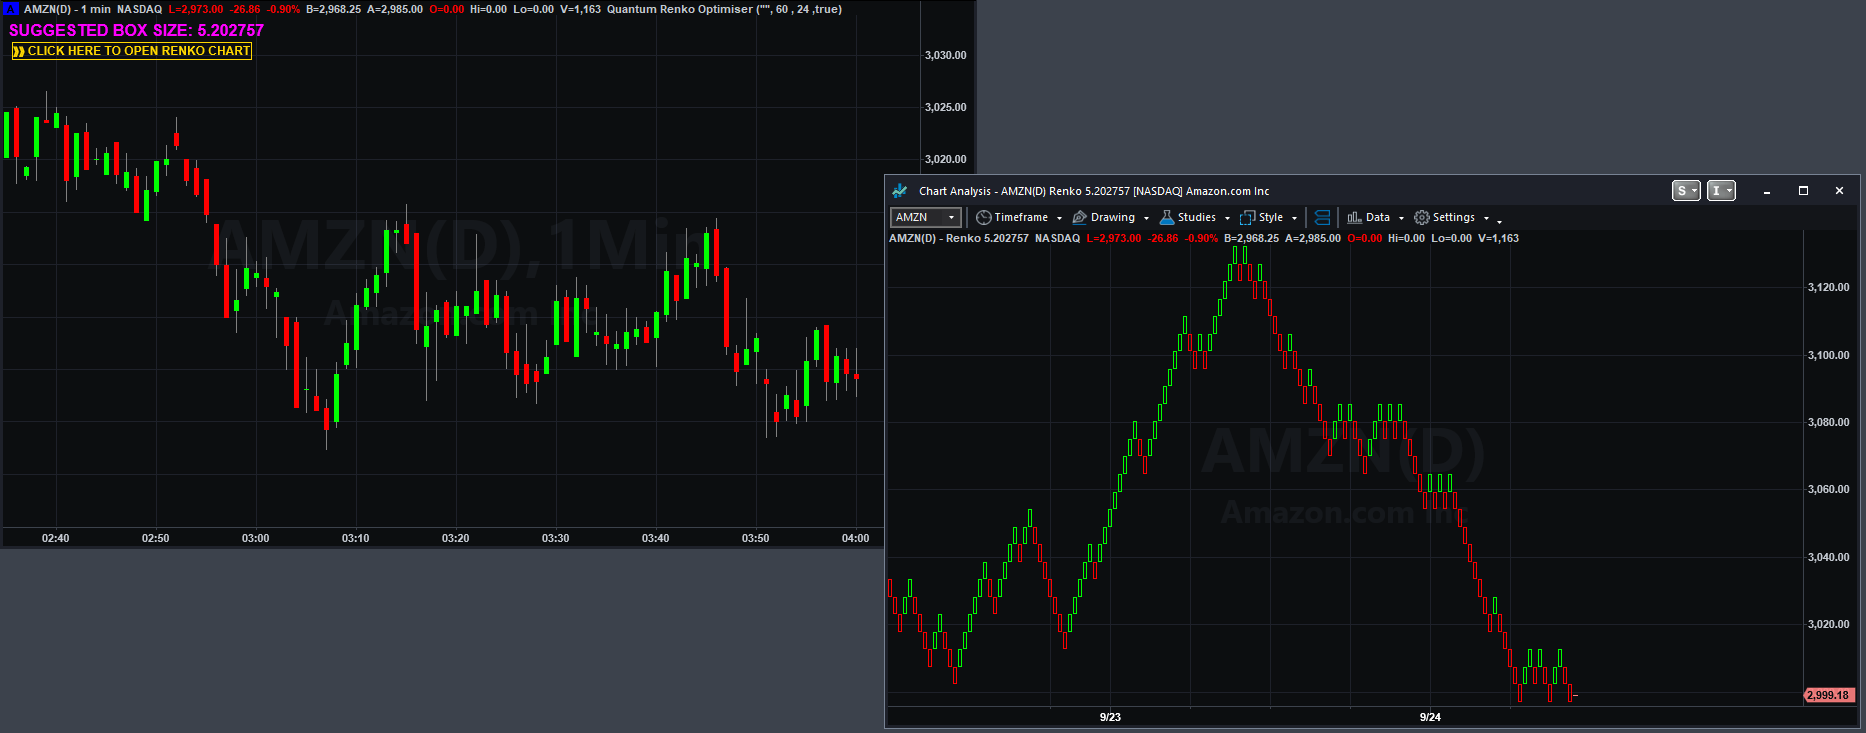
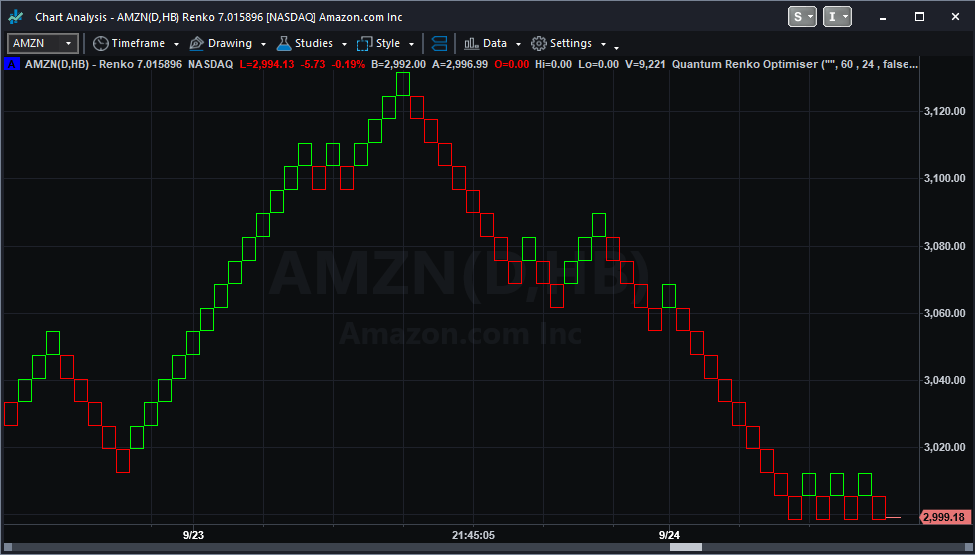
Everything is then encapsulated in a button conveniently located at the top of the chart. This button displays the calculated best brick size for the current market and timeframe selected. By clicking the button, the indicator automatically reconfigures the current candlestick chart to switch to an optimized TradeStation Renko chart using the calculated brick size.
The Renko Optimiser indicator has been streamlined to bring you an intuitive trading experience when working with Renko charts in the TradeStation platform. You can start using it in 2 easy steps:
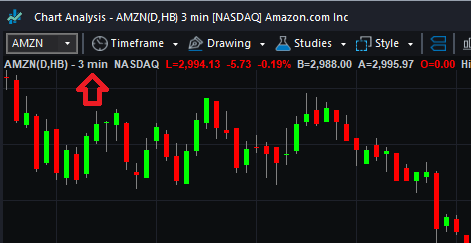
Step 1: Open a time chart of the instrument of your choice and apply the Quantum Renko Optimiser. (Make sure that the chart type is time-based. Example: 3 Minute)
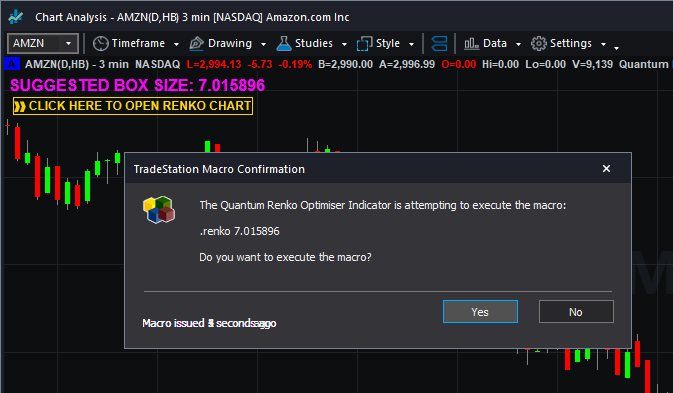
Step 2: When applied, the indicator calculates the best box size in the context of the current timeframe and displays it in a button located at the top of the chart. Simply click this button to launch the macro that opens the Renko chart with the current calculated best box size.
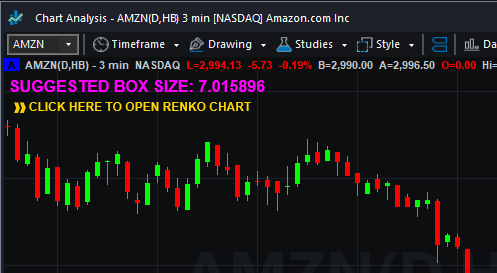
Step 3: Click Yes when the TradeStation Macro Confirmation dialog box appears.
Please note that the button is hidden while the chart is in Renko mode. You can reactivate it by switching the chart back to a time-based chart.
Using the indicator in TradeStation Securities
Applying the indicator to a Chart Analysis window
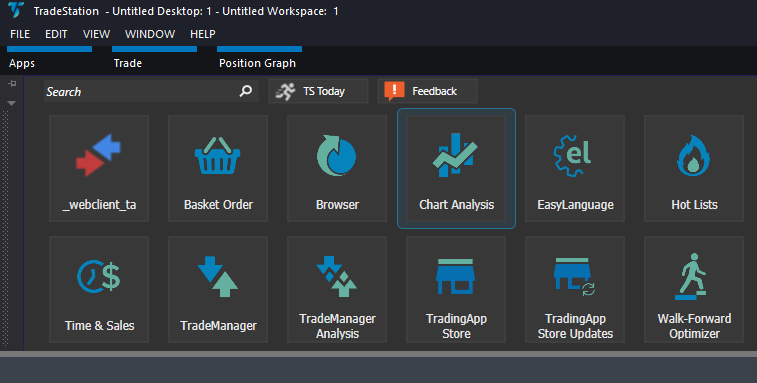
From the Apps menu of your TradeStation platform, please open a Chart Analysis window.
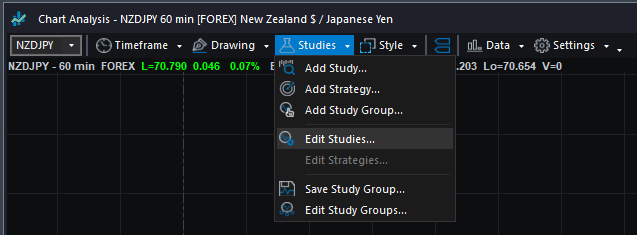
From the Chart Analysis window’s toolbar, please click Studies > Add Study…
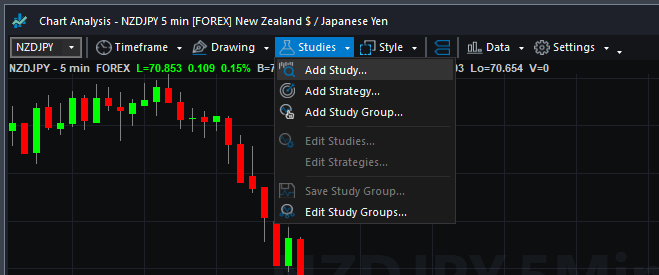
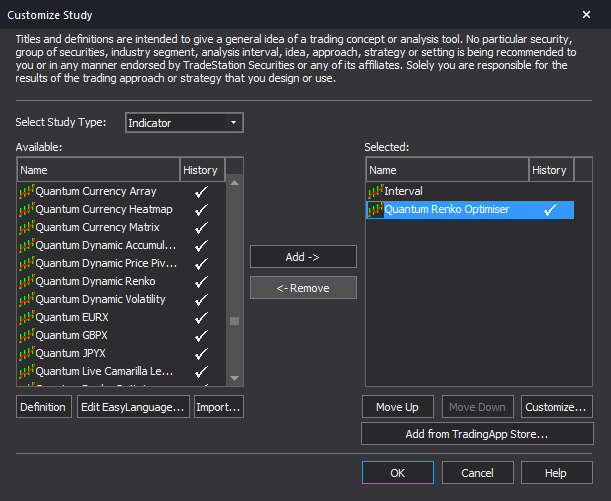
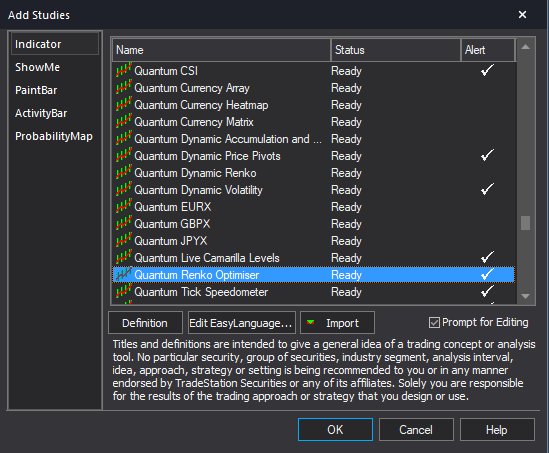
From the Add Study window, please choose Indicator at the left hand side of the interface then at the right, scroll down and select Quantum Renko Optimiser. Click OK to apply the indicator to the chart.
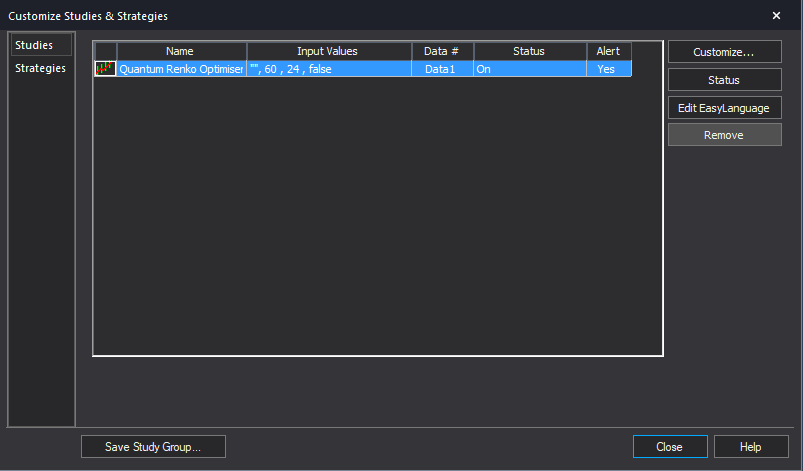
IMPORTANT: If this is your first time to run Quantum Trading indicators, the indicator will not work until you input your email address in its settings. To do this, please go back to your Chart Analysis window and click Studies > Edit Studies…
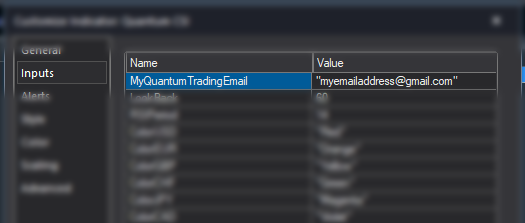
Select the indicator from the list then turn it On by clicking the Status button at the right hand side of the window. Click Customize… or double-click the Quantum Renko Optimiser to open the Customize Indicator window. In the Inputs section, find the MyQuantumTradingEmail input and enter here the email address you used at the Quantum Trading Shop to activate the indicator. PLEASE MAKE SURE TO ENCLOSE THE EMAIL ADDRESS IN DOUBLE QUOTATION MARKS. (example: “myemailaddress@gmail.com”)
Click OK (and Close) to save and go back to your chart. Please note that you need to do this only once which means you do not need to input your email address again when running Quantum Trading indicators next time.
Customizing the indicator in Chart Analysis
Inputs
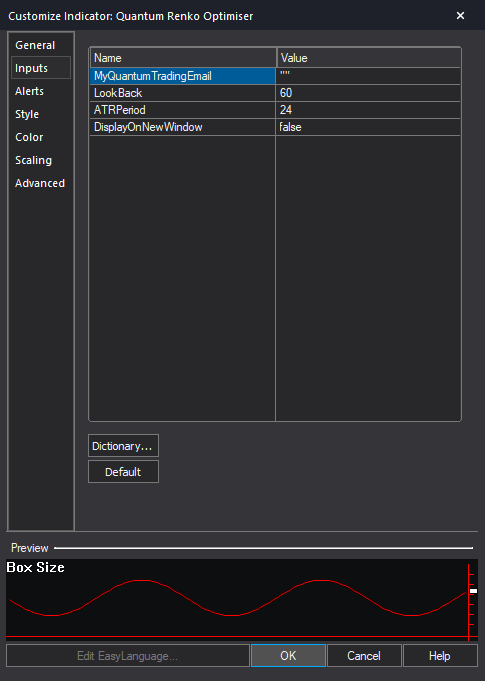
- MyQuantumTradingEmail – When running the indicator for the first time in your TradeStation trading account, you need to enter the email address you used to purchase the indicator in the Quantum Trading Shop as part of its verification process. You need to do this only once as the indicators “remember” your email address by storing it in the local drive. Please make sure that you enter your email address correctly and exactly without any extra spaces before and after it. If you made an error, simply fill this input again to update it. This is a string input which requires you to enclose your email address in double quotation marks (“”).
- LookBack – This input is used to determine the total number of bars to include in calculating the best box size in the period.
- ATRPeriod – This input determines the length of the ATR function for calculating the best box size.
- DisplayOnNewWindow – When this input’s value is “true”, the indicator opens a new chart window to display the resulting Renko chart instead of transforming the current window into a Renko chart.
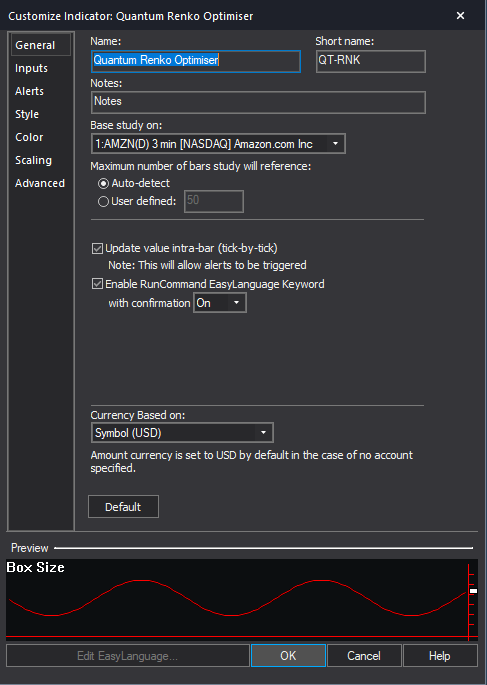
General
You can modify the name, short name, notes, maximum number of bars the indicator will reference, and more. We do not recommend changing any of the settings in this section but you can learn more about the different options in the General tab in TradeStation’s help guide at the link below.
http://help.tradestation.com/10_00/eng/tradestationhelp/study/customize_study_general.htm
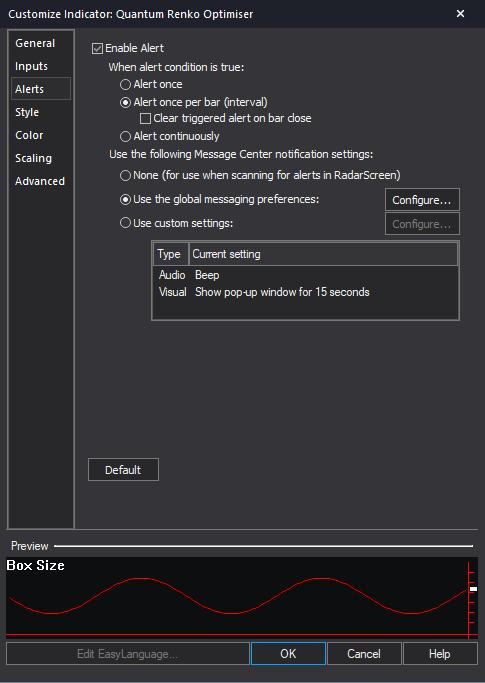
Alerts
This section controls the alert functions of the indicator. The indicator sends an alert when the chart type changes to anything else aside from a time-based chart to let the user know that the indicator is inactive.
You can learn more about the different options in the Alerts tab in TradeStation’s help guide at the link below.
http://help.tradestation.com/10_00/eng/tradestationhelp/study/customize_study_alerts.htm
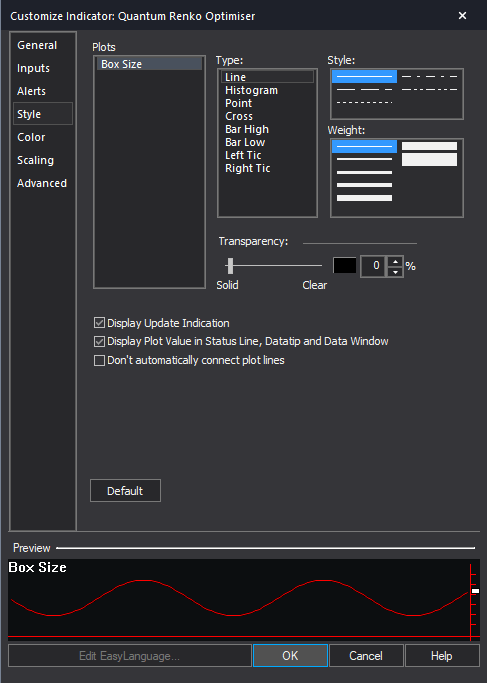
Style
We do not recommend changing the settings in this section as the Renko Optimiser indicator do not use plots.
You can learn more about the different options in the Style tab in TradeStation’s help guide at the link below.
http://help.tradestation.com/10_00/eng/tradestationhelp/study/customize_study_style.htm
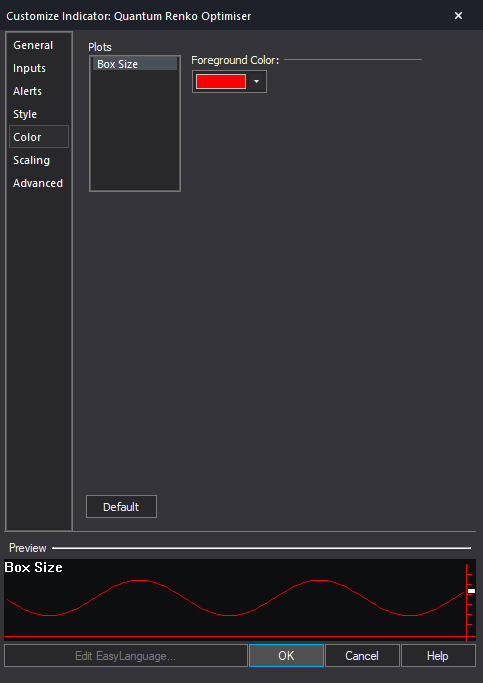
Color
We do not recommend changing the settings in this section. If you like to customize the color of the Renko chart, you can do so by right-clicking the chart then select Style > Customize…
You can learn more about the different options in the Color tab in TradeStation’s help guide at the link below.
http://help.tradestation.com/10_00/eng/tradestationhelp/study/customize_study_color.htm
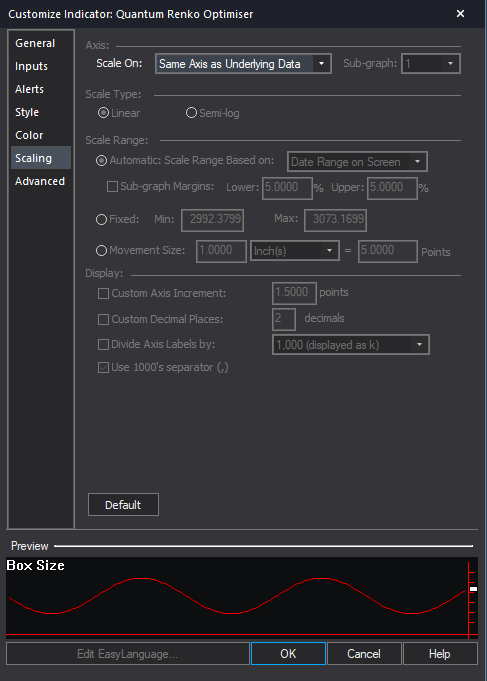
Scaling
The Scaling tab is used to modify the scaling settings for the y-axis of the indicator in the active Chart Analysis window. We do not recommend changing any of the settings in this section but you can learn more about the different options in the Scaling tab in TradeStation’s help guide at the link below.
http://help.tradestation.com/10_00/eng/tradestationhelp/study/customize_study_scaling.htm
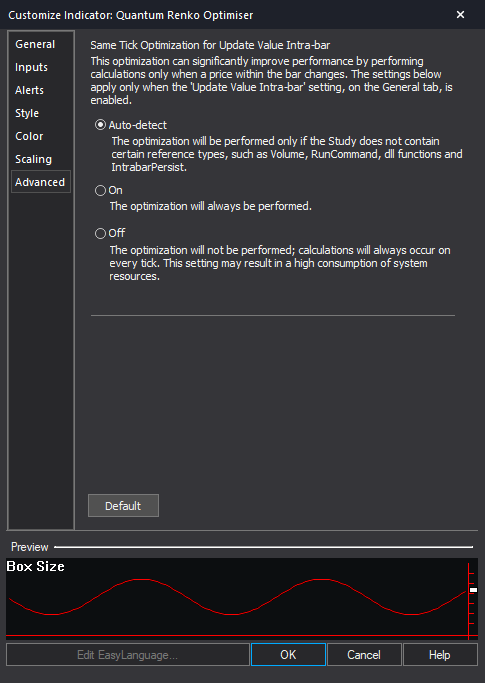
Advanced
The Advanced tab allows you to set advanced preferences for the indicator. We do not recommend changing any of the settings in this section but you can learn more about the different options in the Advanced tab in TradeStation’s help guide at the link below.
http://help.tradestation.com/10_00/eng/tradestationhelp/study/customize_study_advanced.htm
Removing the indicator from the Chart Analysis window
From the Chart Analysis window’s toolbar, please click Studies > Edit Studies…
In the Studies tab, select Quantum Renko Optimiser and click Remove then click Close.
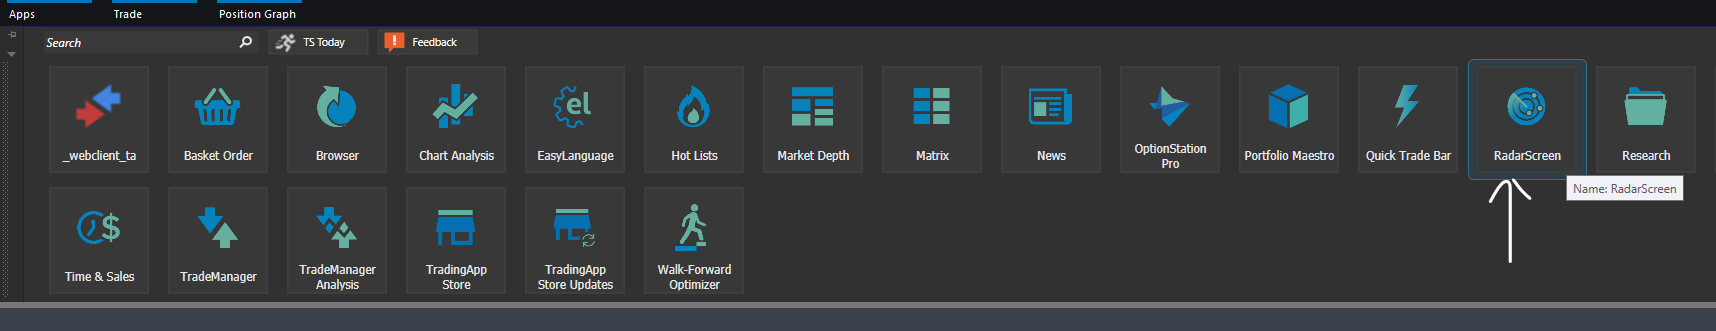
Applying the indicator to RadarScreen
From the Apps menu of your TradeStation platform, please open a RadarScreen window.
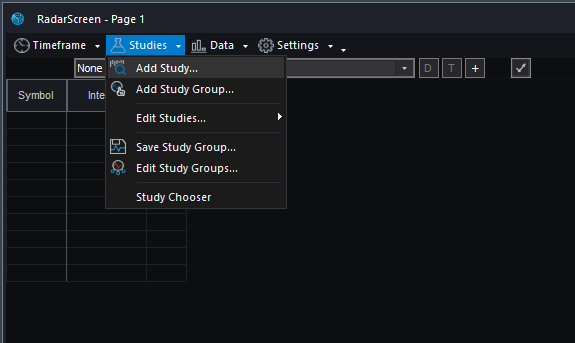
From the RadarScreen window’s toolbar, please click Studies > Add Study…
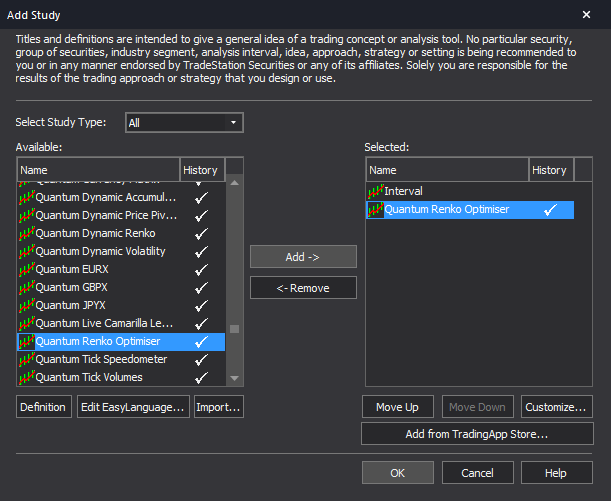
From the Add Study window, please choose Indicator at the left hand side of the interface then at the right, scroll down and select Quantum Renko Optimiser. Click OK to apply the indicator to the chart.
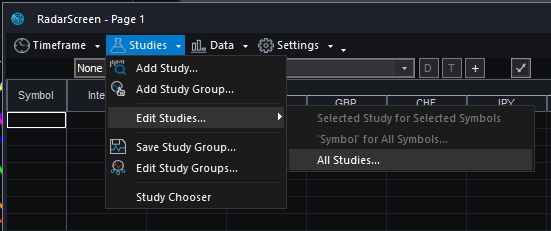
IMPORTANT: If this is your first time to run Quantum Trading indicators, the indicator will not work until you input your email address in its settings. To do this, please go back to your RadarScreen window and click Studies > Edit Studies… > All Studies…
Double-click the Quantum Renko Optimiser to open the Customize Indicator window. In the Inputs section, find the MyQuantumTradingEmail input and enter here the email address you used at the Quantum Trading Shop to activate the indicator. PLEASE MAKE SURE TO ENCLOSE THE EMAIL ADDRESS IN DOUBLE QUOTATION MARKS. (example: “myemailaddress@gmail.com”)
Click OK (and Close) to save and go back to RadarScreen. Please note that you need to do this only once which means you do not need to input your email address again when running Quantum Trading indicators next time.
Compatible symbols in RadarScreen
The Quantum Renko Optimiser indicator works with any symbol.
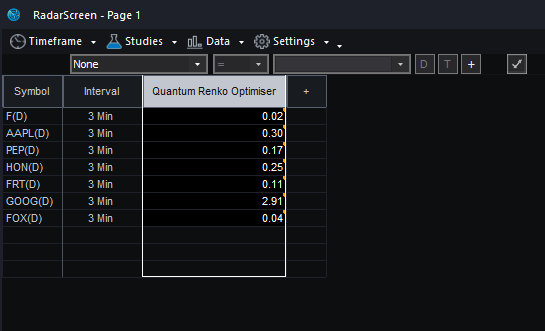
RadarScreen columns
The Renko Optimiser indicator has only 1 column when applied to RadarScreen and it displays the optimized box size calculated for the row’s current interval (timeframe).
Removing the indicator from RadarScreen
From the RadarScreen window’s toolbar, please click Studies > Edit Study… > All Studies… then select/click Quantum Renko Optimiser in the list at right hand side of the window. Click the “<- Remove” button then click OK to close the window.