Overview The Live Camarilla Levels Indicator
The words powerful, unique and game changing are ones that are often over used when applied to trading indicators, but for the Quantum Live Camarilla Levels indicator, they truly describe this new and exciting indicator completely.
Why? Because the indicator has something to offer every trader, from the systematic to the discretionary and from swing trading to breakout trading. And it’s not an indicator which is simply used for entries. The Camarilla indicator delivers in all areas, from getting in to getting out as well as stop loss placement. All in one single indicator which perhaps explains its unique appeal and power to those traders in the know. Now, it’s all here just waiting for you to discover the power of the Camarilla protocol and apply this unique indicator to your own trading and investing tactics.
So what is the Camarilla protocol, how does it work and what will it do for me? These are all good questions, so let’s get straight down to basics and explain how the indicator works and how you may wish to use it.
Let’s start with the last of these questions first, as this is one of the unique aspects to this indicator. Put simply it is a chameleon of an indicator, and will appeal whether you are a more discretionary type of trader, making and taking decisions yourself, or if you prefer a more systematic or mechanical approach often associated with a trading robot for example. With the Camarilla levels indicator both approaches can be embraced and accommodated.
The Camarilla protocol has its roots in the open outcry trading pits, where traders considered floor pivots an essential tool. Based on these original ideas and incorporating the Camarilla equation we have developed a unique indicator which delivers clear and precise price based support and resistance levels, which act as targets for profits, triggers for potential reversals, signals for possible breakouts, and finally stop loss placement. So, if you’re a swing or reversal trader, it’s the perfect indicator. Equally if you prefer breakout trading, again it’s the perfect indicator. And all with predetermined and clear levels for any price objectives and profit targets, with stop loss placement covered also.
In other words a complete indicator, and one which is delivered with potential trading setups built in to help you see when key levels are being approached or breached.
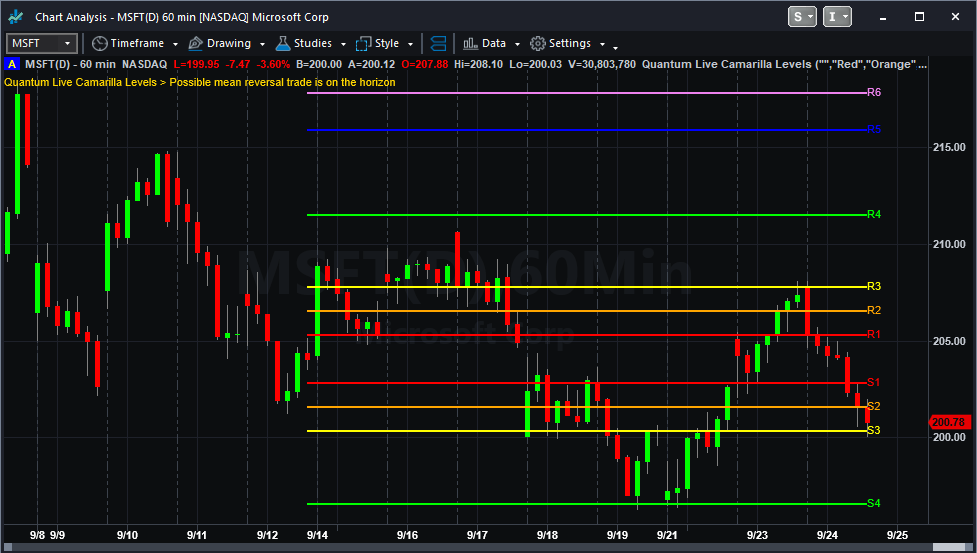
The indicator works in a complex way, but the data is presented simply using six levels above the price action and six levels below. Those above are labelled R1 to R6 and those below S1 to S6 with the region between R1 and S1 which we describe as the ‘buffer zone’. These levels are calculated for the different timeframes in different ways.
For daily timeframes and above the levels remain the same for the month, and they are then recalculated at the start of the new month. For intraday timeframes these are recalculated at the start of each new daily session.
Reversal Trading
For reversal trading the key levels to watch are S3 and R3. These are levels which when approached signal potential reversals. So when price is approaching and tests the S3 level below the buffer zone, a reversal to the upside may be on the horizon. In other words a reversal from a bearish trend to a bullish trend in that timeframe. Equally, when price is approaching and testing the R3 level above the buffer zone, then a reversal is possible with the bullish price action reversing to bearish. In both cases the next level then denotes the level for the stop loss. For a reversal off the S3 level higher, the stop loss could be placed at S4 and for a reversal off the R3 level, the stop loss could be placed at the R4 level – assuming these levels fit your risk and money management rules.
The potential price targets are then as follows:
For an R3 reversal the profit targets are from S1 to S3.
For an S3 reversal the profit targets are from R1 to R3.
Breakout Trading
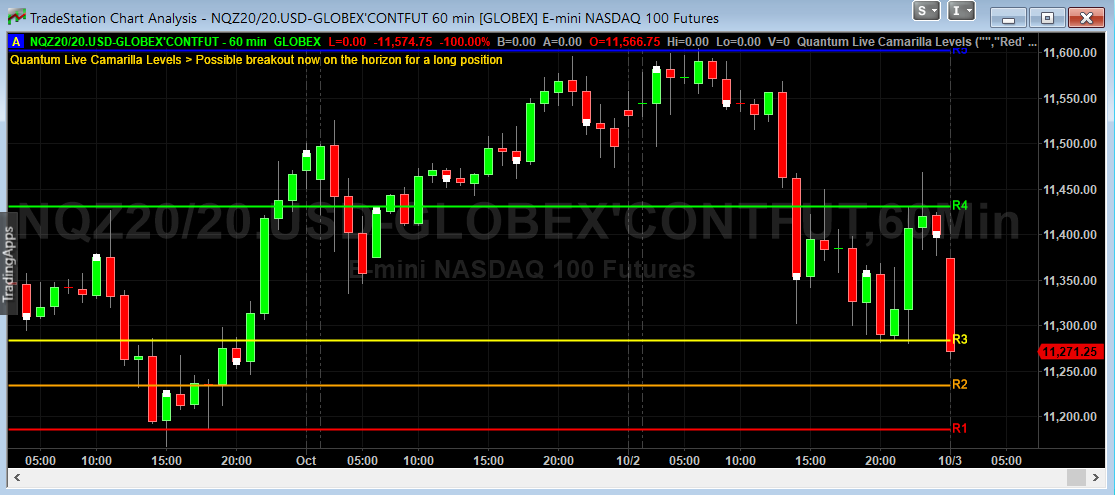
For breakout trading the key levels are the R4 above the buffer zone and the S4 below. These are levels at which the price is expected to breakout from the current region and develop a strong move away from the region. So any move to test and break the R4 level is likely to see price continue higher and develop a strong trend. Equally if the S4 level is tested, then price is likely to continue lower and develop a strong trend.
For an S4 breakout the profit targets are S5 to S6
For an R4 breakout the profit targets are R5 to R6
Using the Camarilla levels in this way offers a complete solution to two distinct approaches to trading, and in addition, also provide potential target levels along with suggested stop loss positions, but as always these must meet your risk and money management rules.
And it is important to understand the indicator and associated levels can be adopted in two very distinct ways.
First, if you are more suited to mechanical trading where you feel more comfortable with a rule set, then the levels can be considered as your rule set. However, if you are more suited to discretionary trading then the indicator is a perfect complement to other Quantum indicators such as the support and resistance indicator, which again is one based purely on price, and so helps to reinforce levels delivered by the Camarilla protocol. Other indicators such as the Trend Monitor also work perfectly in association with this indicator.
The Camarilla levels indicator works in all timeframes on both standard and custom charts, and in every market, so can be used to trade stocks, commodities, forex or indices on the TradeStation platform.
So whether you’re a discretionary trader who prefers swing trading, or a breakout trader who is more systematic, the Camarilla levels indicator can deliver it all.
To help you when using the indicator we have also included some simple messages to guide you as the various levels are approached and tested. These appear as follows :
- If the current open price is between R3 and S3 the indicator displays the words – Possible mean reversal trade is on the horizon
- If the current open price is between S3 and S2 the indicator displays the words – Possible long position now on the horizon
- If the current open price is between R3 and R2 the indicator displays the words – Possible short position now on the horizon
- If the current open price is between R3 and R4 the indicator displays the words – Possible breakout now on the horizon for a long position
- If the current open price is between S3 and S4 the indicator displays the words – Possible breakout now on the horizon for a short position
When there is nothing of interest, the indicator displays the message – Analysing the chart…
You can of course elect to switch these messages off, and they are only included to alert you to possible set ups occurring.
Using the indicator in TradeStation Securities
Applying the indicator to a Chart Analysis window
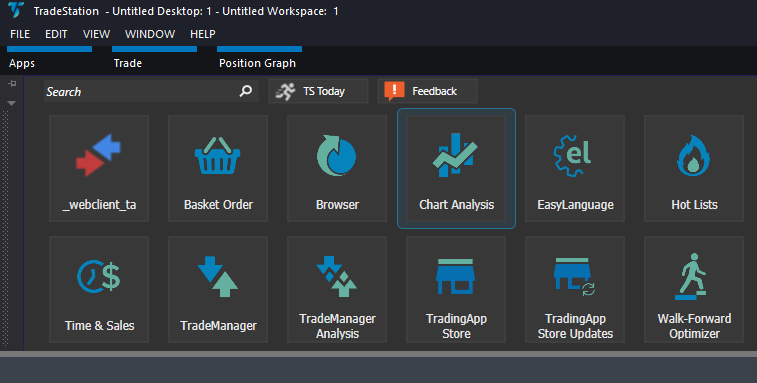
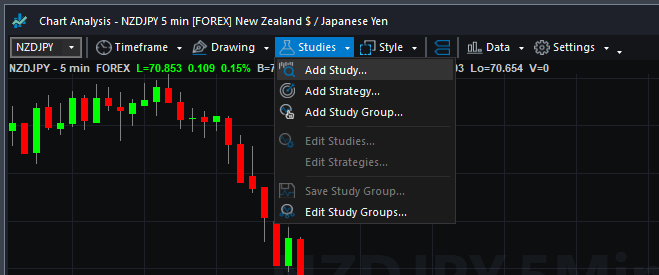
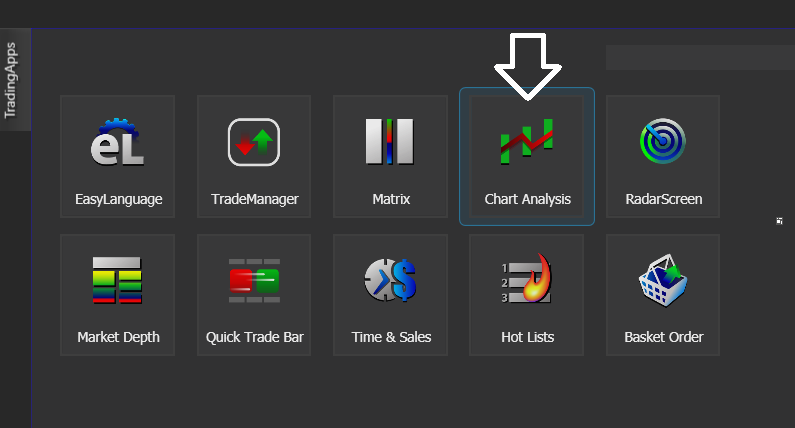
From the Apps menu of your TradeStation platform, please open a Chart Analysis window.
From the Chart Analysis window’s toolbar, please click Studies > Add Study…
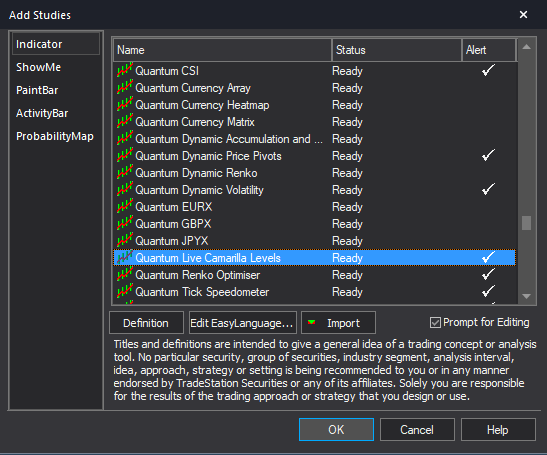
From the Add Study window, please choose Indicator at the left hand side of the interface then at the right, scroll down and select Quantum Live Camarilla Levels. Click OK to apply the indicator to the chart.
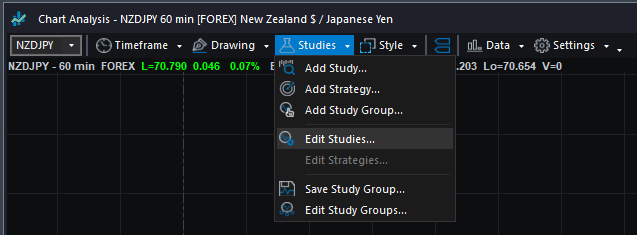
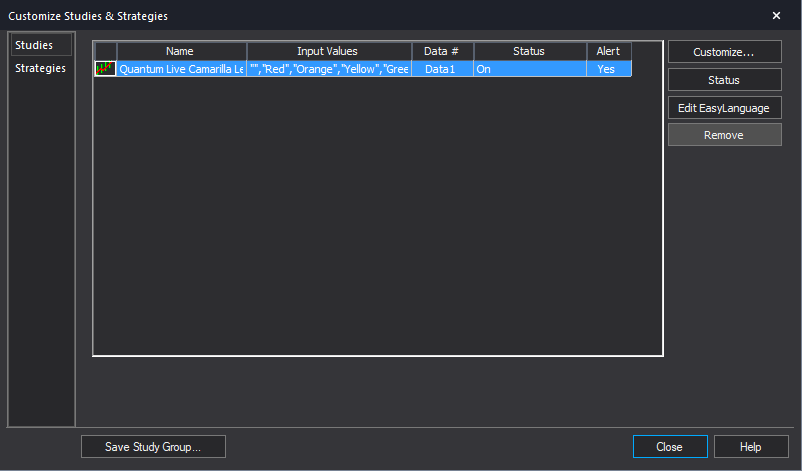
IMPORTANT: If this is your first time to run Quantum Trading indicators, the indicator will not work until you input your email address in its settings. To do this, please go back to your Chart Analysis window and click Studies > Edit Studies…
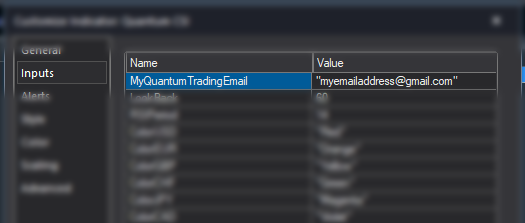
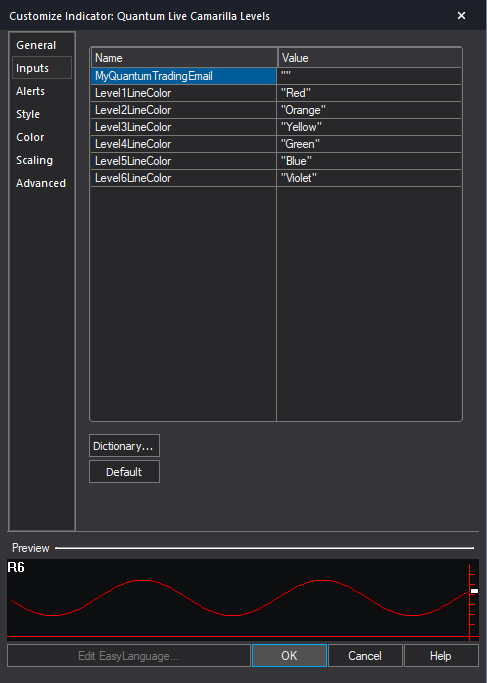
Select the indicator from the list then turn it On by clicking the Status button at the right hand side of the window. Click Customize… or double-click the Quantum Live Camarilla Levels to open the Customize Indicator window. In the Inputs section, find the MyQuantumTradingEmail input and enter here the email address you used at the Quantum Trading Shop to activate the indicator. PLEASE MAKE SURE TO ENCLOSE THE EMAIL ADDRESS IN DOUBLE QUOTATION MARKS. (example: “myemailaddress@gmail.com”)
Click OK (and Close) to save and go back to your chart. Please note that you need to do this only once which means you do not need to input your email address again when running Quantum Trading indicators next time.
Customizing the indicator in Chart Analysis
Inputs
- MyQuantumTradingEmail – When running the indicator for the first time in your TradeStation trading account, you need to enter the email address you used to purchase the indicator in the Quantum Trading Shop as part of its verification process. You need to do this only once as the indicators “remember” your email address by storing it in the local drive. Please make sure that you enter your email address correctly and exactly without any extra spaces before and after it. If you made an error, simply fill this input again to update it. This is a string input which requires you to enclose your email address in double quotation marks (“”).
- Level1LineColor – This input defines the color of the lines that represent the S1 and R1 Camarilla levels. As a string input, you need to enclose the name color in double quotation marks (“”). Named colors are the only accepted values in these inputs which are all listed in the following link – http://help.tradestation.com/09_01/tsdevhelp/Subsystems/elobject/class_win/color_class.htm. The color of a line reverts to the default named color if the input’s value is invalid.
- Level2LineColor – This input defines the color of the lines that represent the S2 and R2 Camarilla levels. As a string input, you need to enclose the name color in double quotation marks (“”). Named colors are the only accepted values in these inputs which are all listed in the following link – http://help.tradestation.com/09_01/tsdevhelp/Subsystems/elobject/class_win/color_class.htm. The color of a line reverts to the default named color if the input’s value is invalid.
- Level3LineColor – This input defines the color of the lines that represent the S3 and R3 Camarilla levels. As a string input, you need to enclose the name color in double quotation marks (“”). Named colors are the only accepted values in these inputs which are all listed in the following link – http://help.tradestation.com/09_01/tsdevhelp/Subsystems/elobject/class_win/color_class.htm. The color of a line reverts to the default named color if the input’s value is invalid.
- Level4LineColor – This input defines the color of the lines that represent the S4 and R4 Camarilla levels. As a string input, you need to enclose the name color in double quotation marks (“”). Named colors are the only accepted values in these inputs which are all listed in the following link – http://help.tradestation.com/09_01/tsdevhelp/Subsystems/elobject/class_win/color_class.htm. The color of a line reverts to the default named color if the input’s value is invalid.
- Level5LineColor – This input defines the color of the lines that represent the S5 and R5 Camarilla levels. As a string input, you need to enclose the name color in double quotation marks (“”). Named colors are the only accepted values in these inputs which are all listed in the following link – http://help.tradestation.com/09_01/tsdevhelp/Subsystems/elobject/class_win/color_class.htm. The color of a line reverts to the default named color if the input’s value is invalid.
- Level6LineColor – This input defines the color of the lines that represent the S6 and R6 Camarilla levels. As a string input, you need to enclose the name color in double quotation marks (“”). Named colors are the only accepted values in these inputs which are all listed in the following link – http://help.tradestation.com/09_01/tsdevhelp/Subsystems/elobject/class_win/color_class.htm. The color of a line reverts to the default named color if the input’s value is invalid.
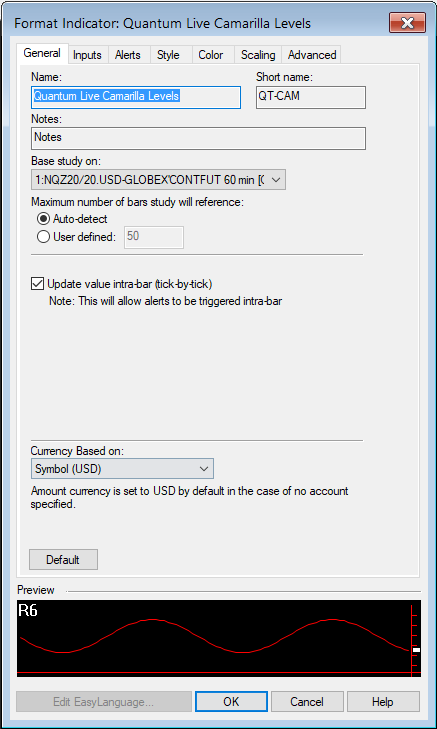
General
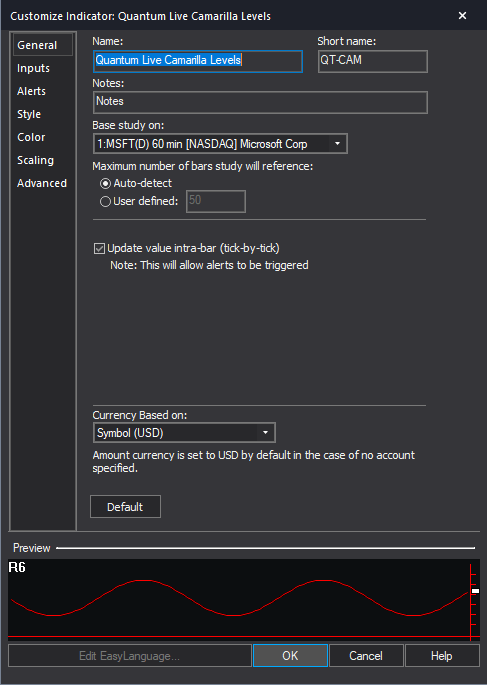
You can modify the name, short name, notes, maximum number of bars the indicator will reference, and more. We do not recommend changing any of the settings in this section but you can learn more about the different options in the General tab in TradeStation’s help guide at the link below.
http://help.tradestation.com/10_00/eng/tradestationhelp/study/customize_study_general.htm
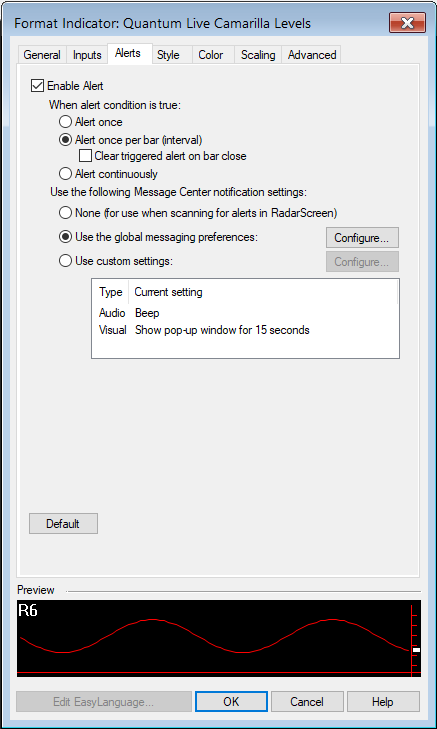
Alerts
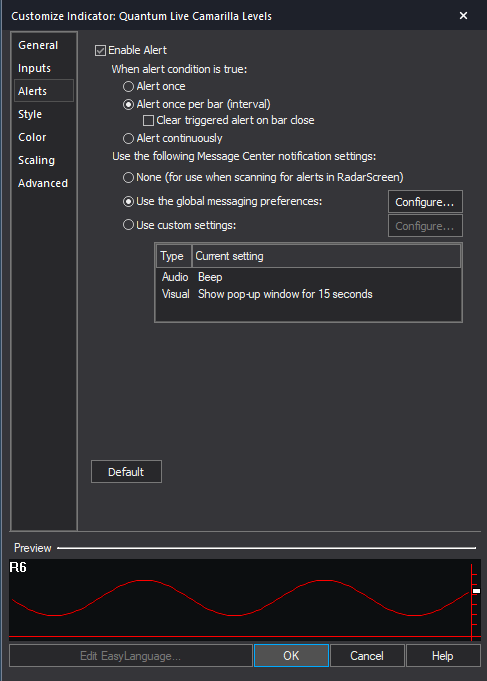
This section controls the alert functions of the indicator. Alerts trigger every time a new message is displayed based on its analysis of the current price action and the position of the Camarilla levels.
You can learn more about the different options in the Alerts tab in TradeStation’s help guide at the link below.
http://help.tradestation.com/10_00/eng/tradestationhelp/study/customize_study_alerts.htm
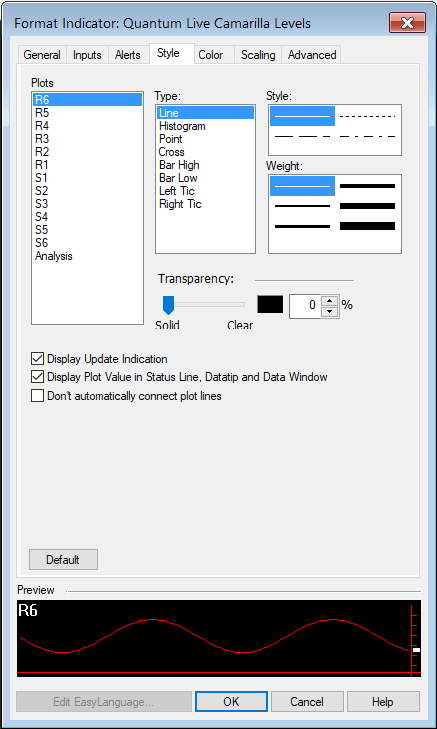
Style
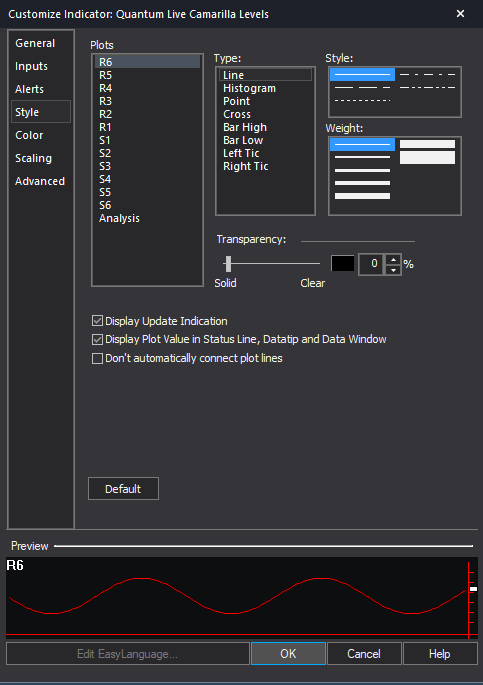
We do not recommend changing the settings in this section as the Live Camarilla Levels indicator uses chart objects instead of plots to create its lines.
You can learn more about the different options in the Style tab in TradeStation’s help guide at the link below.
http://help.tradestation.com/10_00/eng/tradestationhelp/study/customize_study_style.htm
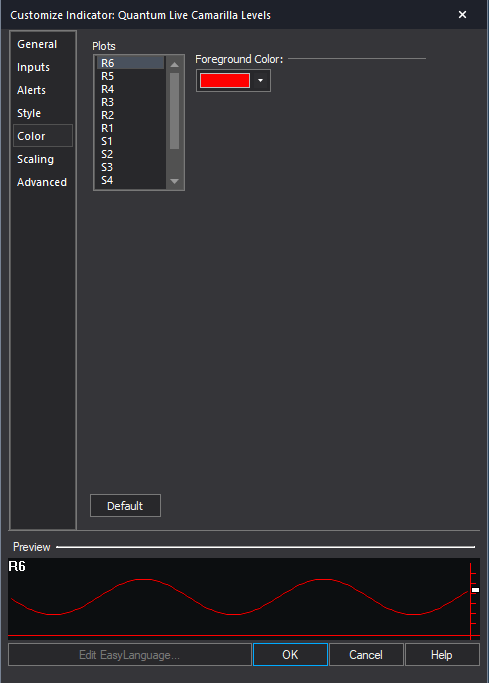
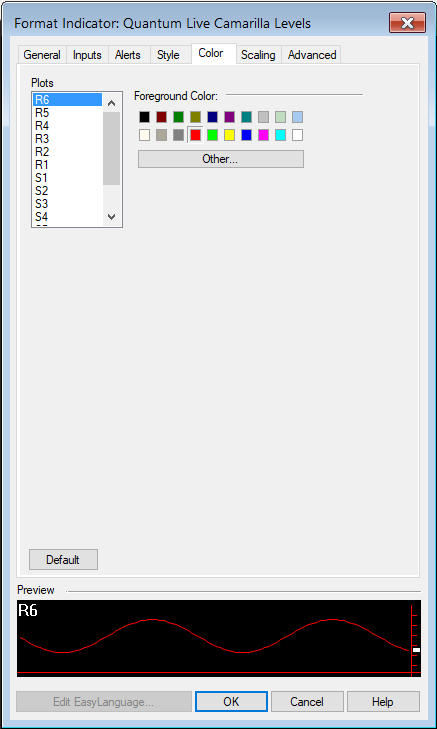
Color
We do not recommend changing the colors of the indicator in this section. Instead, please use the user defined color variables in the indicator’s Inputs to safely change the color of the lines and labels.
You can learn more about the different options in the Color tab in TradeStation’s help guide at the link below.
http://help.tradestation.com/10_00/eng/tradestationhelp/study/customize_study_color.htm
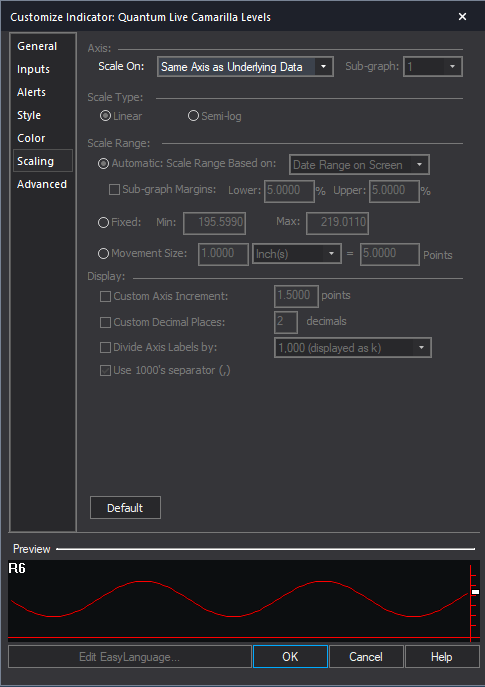
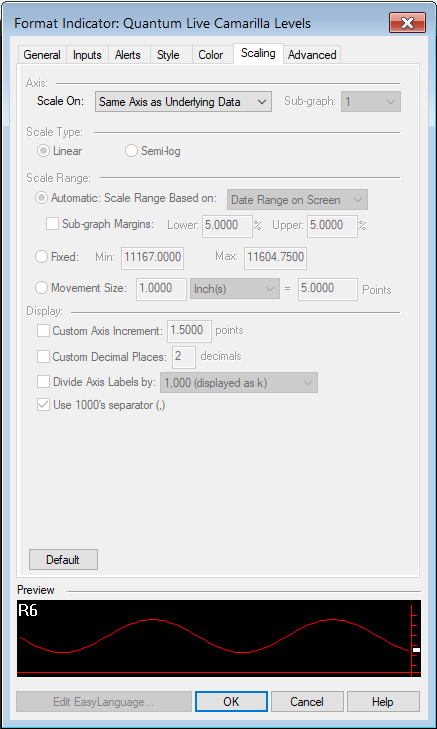
Scaling
The Scaling tab is used to modify the scaling settings for the y-axis of the indicator in the active Chart Analysis window. We do not recommend changing any of the settings in this section but you can learn more about the different options in the Scaling tab in TradeStation’s help guide at the link below.
http://help.tradestation.com/10_00/eng/tradestationhelp/study/customize_study_scaling.htm
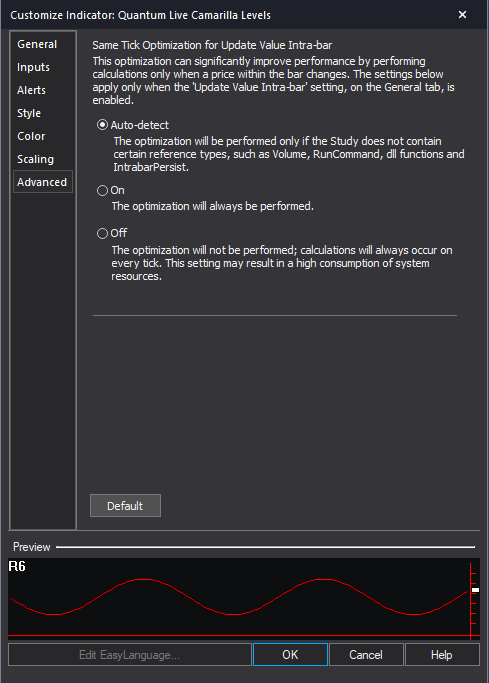
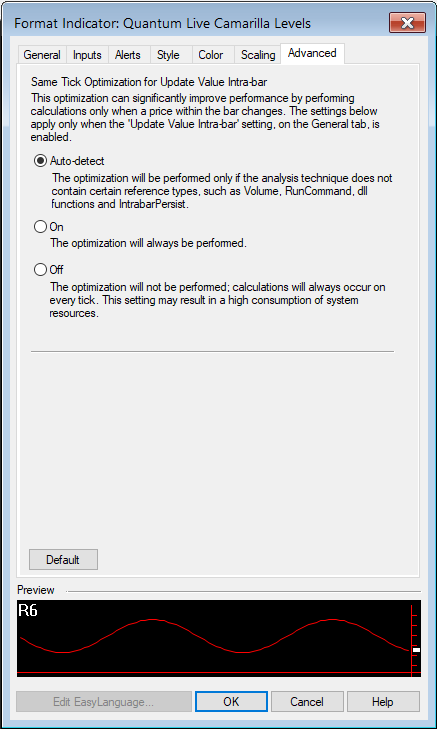
Advanced
The Advanced tab allows you to set advanced preferences for the indicator. We do not recommend changing any of the settings in this section but you can learn more about the different options in the Advanced tab in TradeStation’s help guide at the link below.
http://help.tradestation.com/10_00/eng/tradestationhelp/study/customize_study_advanced.htm
Removing the indicator from the Chart Analysis window
From the Chart Analysis window’s toolbar, please click Studies > Edit Studies…
In the Studies tab, select Quantum Live Camarilla Levels and click Remove then click Close.
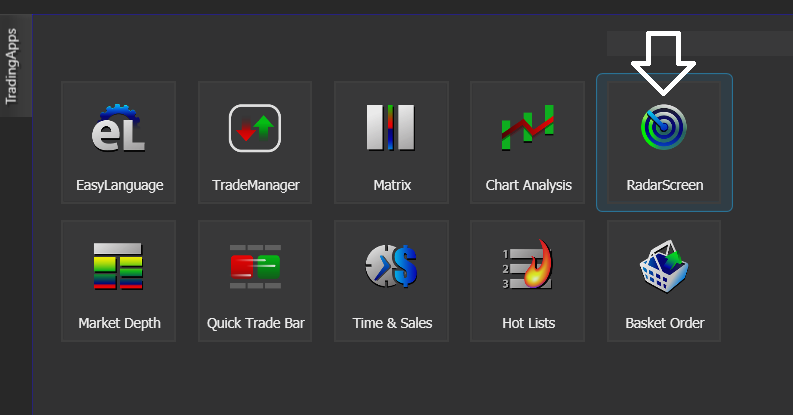
Applying the indicator to RadarScreen
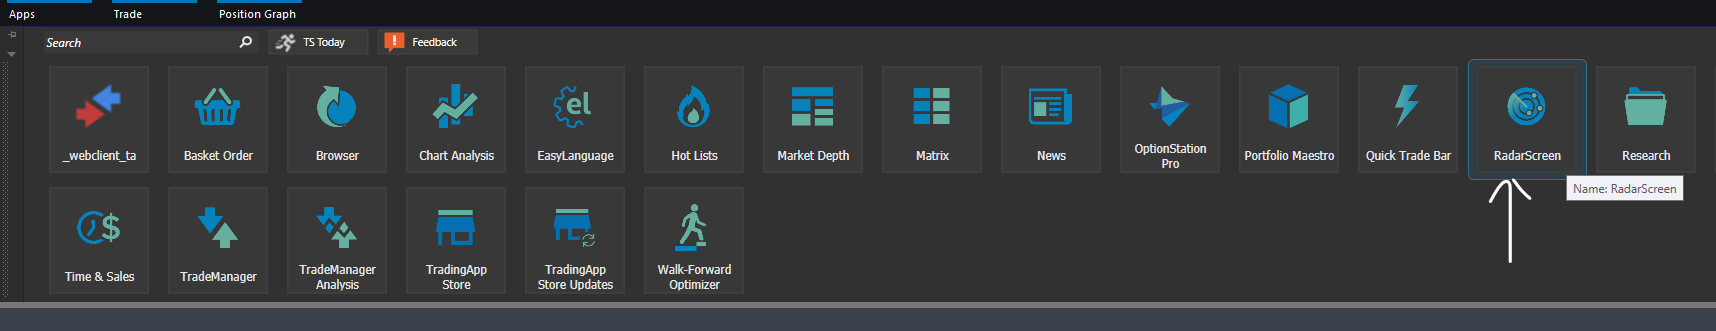
From the Apps menu of your TradeStation platform, please open a RadarScreen window.
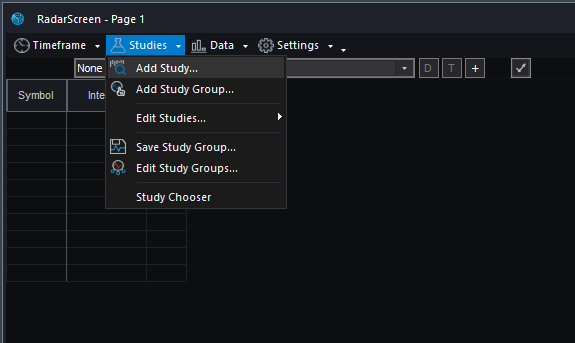
From the RadarScreen window’s toolbar, please click Studies > Add Study…
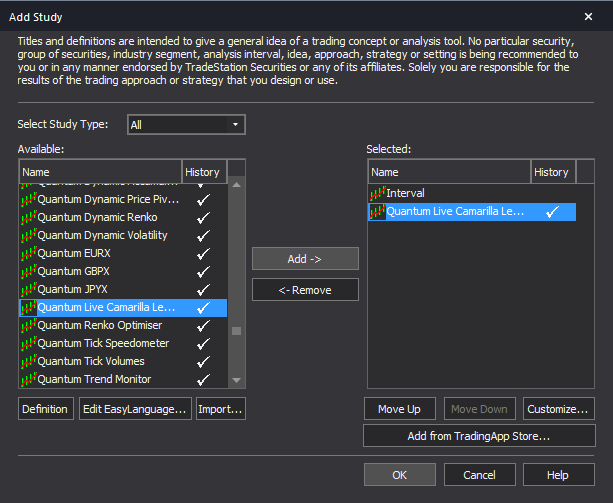
From the Add Study window, please choose Indicator at the left hand side of the interface then at the right, scroll down and select Quantum Live Camarilla Levels. Click OK to apply the indicator to the chart.
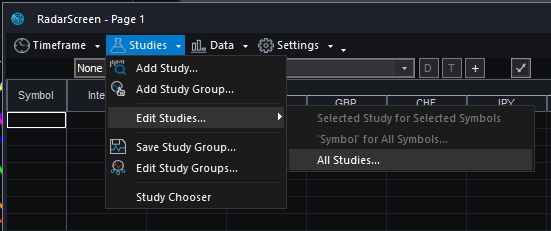
IMPORTANT: If this is your first time to run Quantum Trading indicators, the indicator will not work until you input your email address in its settings. To do this, please go back to your RadarScreen window and click Studies > Edit Studies… > All Studies…
Double-click the Quantum Live Camarilla Levels to open the Customize Indicator window. In the Inputs section, find the MyQuantumTradingEmail input and enter here the email address you used at the Quantum Trading Shop to activate the indicator. PLEASE MAKE SURE TO ENCLOSE THE EMAIL ADDRESS IN DOUBLE QUOTATION MARKS. (example: “myemailaddress@gmail.com”)
Click OK (and Close) to save and go back to RadarScreen. Please note that you need to do this only once which means you do not need to input your email address again when running Quantum Trading indicators next time.
Compatible symbols in RadarScreen
The Quantum Live Camarilla Levels indicator works with any symbol.
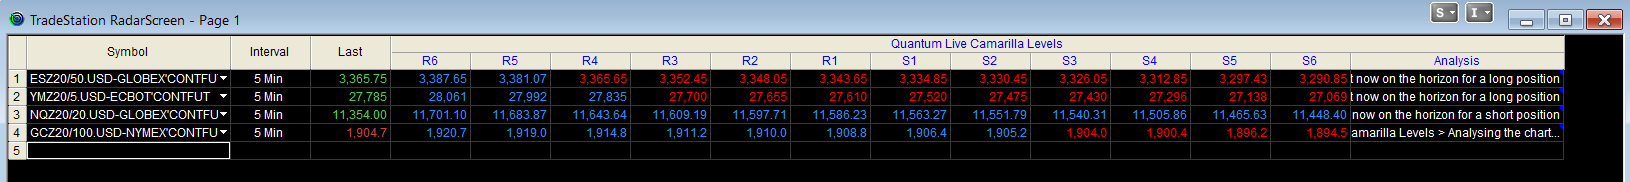
RadarScreen columns
R6-R1
These columns show the 6 Resistance price levels of the Camarilla in the current row’s interval (timeframe)
S1-S6
These columns show the 6 Support price levels of the Camarilla in the current row’s interval (timeframe)
Analysis
Displays simple messages to guide you as the various levels are approached and tested.
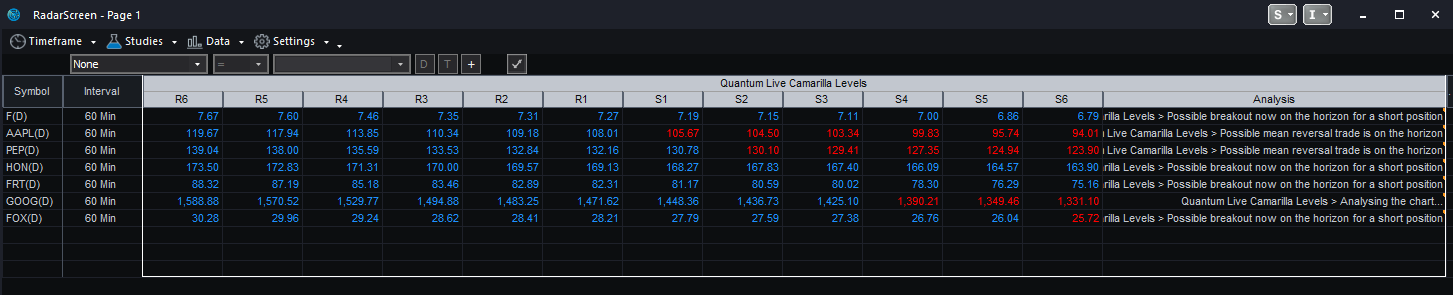
Color changes in the RadarScreen
The cell’s background and text color may change on certain conditions.
Text color changes
- Columns R6-R1 and S1-S6 turn RED if the Camarilla price level (column) is BELOW the symbol’s
current price - Columns R6-R1 and S1-S6 turn BLUE if the Camarilla price level (column) is ABOVE the symbol’s
current price
Removing the indicator from RadarScreen
From the RadarScreen window’s toolbar, please click Studies > Edit Study… > All Studies… then select/click Quantum Live Camarilla Levels in the list at right hand side of the window. Click the “<- Remove” button then click OK to close the window.
Using the indicator in TradeStation Global
Applying the indicator to a Chart Analysis window
From the Apps menu of your TradeStation platform, please open a Chart Analysis window.
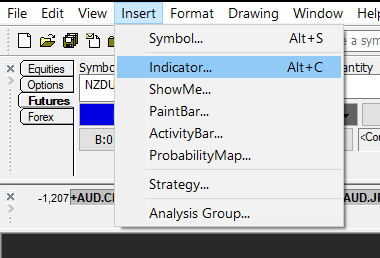
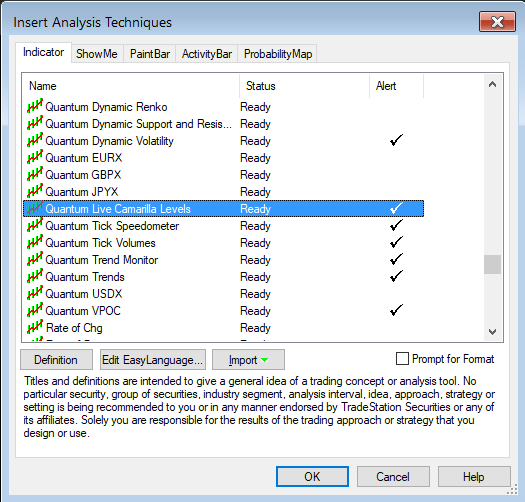
From the menu bar, click Insert > Indicator… > Indicator tab then scroll down at the list and select the Quantum Live Camarilla Levels and click OK to apply the indicator in the chart.
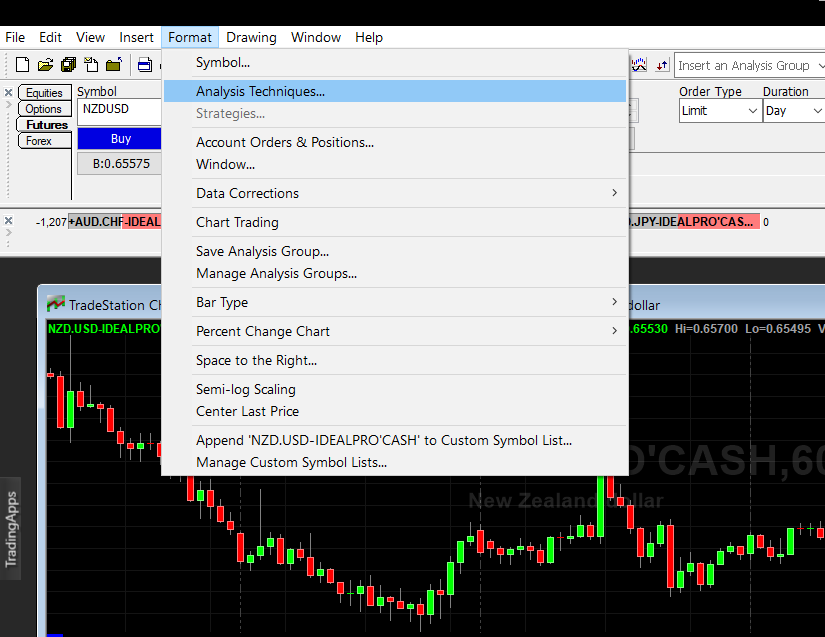
IMPORTANT: If this is your first time to run Quantum Trading indicators, the indicator will not work until you input your email address in its settings. To do this, please go back to your Chart Analysis window then in the menu bar, click Format > Analysis Techniques…
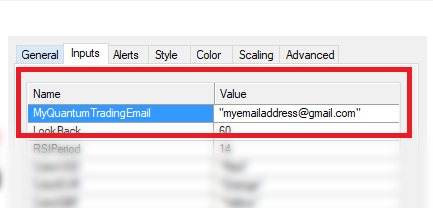
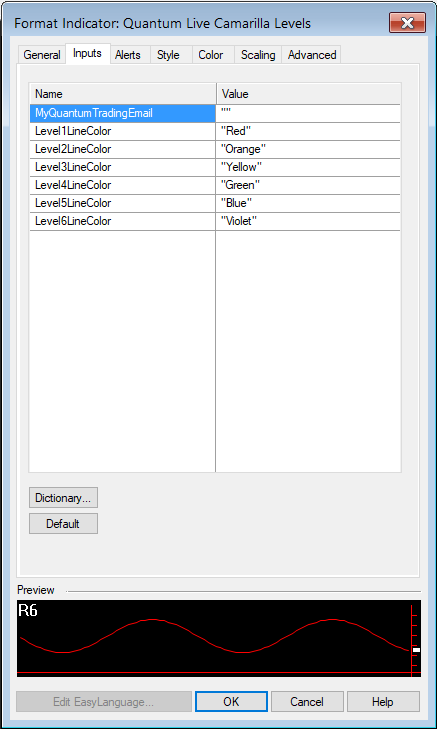
Select the indicator from the list then turn it On by clicking the Status button at the right hand side of the window. Click Format… or double-click the Quantum Live Camarilla Levels to open the Format Indicator window. In the Inputs section, find the MyQuantumTradingEmail input and enter here the email address you used at the Quantum Trading Shop to activate the indicator. PLEASE MAKE SURE TO ENCLOSE THE EMAIL ADDRESS IN DOUBLE QUOTATION MARKS. (example: “myemailaddress@gmail.com”)
Click OK (and Close) to save and go back to your chart. Please note that you need to do this only once which means you do not need to input your email address again when running Quantum Trading indicators next time.
Customizing the indicator in Chart Analysis
Inputs
- MyQuantumTradingEmail – When running the indicator for the first time in your TradeStation trading account, you need to enter the email address you used to purchase the indicator in the Quantum Trading Shop as part of its verification process. You need to do this only once as the indicators “remember” your email address by storing it in the local drive. Please make sure that you enter your email address correctly and exactly without any extra spaces before and after it. If you made an error, simply fill this input again to update it. This is a string input which requires you to enclose your email address in double quotation marks (“”).
- Level1LineColor – This input defines the color of the lines that represent the S1 and R1 Camarilla levels. As a string input, you need to enclose the name color in double quotation marks (“”). Named colors are the only accepted values in these inputs which are all listed in the following link – http://help.tradestation.com/09_01/tsdevhelp/Subsystems/elobject/class_win/color_class.htm. The color of a line reverts to the default named color if the input’s value is invalid.
- Level2LineColor – This input defines the color of the lines that represent the S2 and R2 Camarilla levels. As a string input, you need to enclose the name color in double quotation marks (“”). Named colors are the only accepted values in these inputs which are all listed in the following link – http://help.tradestation.com/09_01/tsdevhelp/Subsystems/elobject/class_win/color_class.htm. The color of a line reverts to the default named color if the input’s value is invalid.
- Level3LineColor – This input defines the color of the lines that represent the S3 and R3 Camarilla levels. As a string input, you need to enclose the name color in double quotation marks (“”). Named colors are the only accepted values in these inputs which are all listed in the following link – http://help.tradestation.com/09_01/tsdevhelp/Subsystems/elobject/class_win/color_class.htm. The color of a line reverts to the default named color if the input’s value is invalid.
- Level4LineColor – This input defines the color of the lines that represent the S4 and R4 Camarilla levels. As a string input, you need to enclose the name color in double quotation marks (“”). Named colors are the only accepted values in these inputs which are all listed in the following link – http://help.tradestation.com/09_01/tsdevhelp/Subsystems/elobject/class_win/color_class.htm. The color of a line reverts to the default named color if the input’s value is invalid.
- Level5LineColor – This input defines the color of the lines that represent the S5 and R5 Camarilla levels. As a string input, you need to enclose the name color in double quotation marks (“”). Named colors are the only accepted values in these inputs which are all listed in the following link – http://help.tradestation.com/09_01/tsdevhelp/Subsystems/elobject/class_win/color_class.htm. The color of a line reverts to the default named color if the input’s value is invalid.
- Level6LineColor – This input defines the color of the lines that represent the S6 and R6 Camarilla levels. As a string input, you need to enclose the name color in double quotation marks (“”). Named colors are the only accepted values in these inputs which are all listed in the following link – http://help.tradestation.com/09_01/tsdevhelp/Subsystems/elobject/class_win/color_class.htm. The color of a line reverts to the default named color if the input’s value is invalid.
General
ou can modify the name, short name, notes, maximum number of bars the indicator will reference, and more. We do not recommend changing any of the settings in this section but you can learn more about the different options in the General tab in TradeStation’s help guide at the link below.
Alerts
This section controls the alert functions of the indicator. Alerts trigger every time a new message is displayed based on its analysis of the current price action and the position of the Camarilla levels.
You can learn more about the different options in the Alerts tab in TradeStation’s help guide at the link below.
Style
We do not recommend changing the settings in this section as the Live Camarilla Levels indicator uses chart objects instead of plots to create its lines.
You can learn more about the different options in the Style tab in TradeStation’s help guide at the link below.
Color
We do not recommend changing the colors of the indicator in this section. Instead, please use the user defined color variables in the indicator’s Inputs to safely change the color of the lines and labels.
You can learn more about the different options in the Color tab in TradeStation’s help guide at the link below.
Scaling
The Scaling tab is used to modify the scaling settings for the y-axis of the indicator in the active Chart Analysis window. We do not recommend changing any of the settings in this section but you can learn more about the different options in the Scaling tab in TradeStation’s help guide at the link below.
Advanced
The Advanced tab allows you to set advanced preferences for the indicator. We do not recommend changing any of the settings in this section but you can learn more about the different options in the Advanced tab in TradeStation’s help guide at the link below.
Removing the indicator from the Chart Analysis window
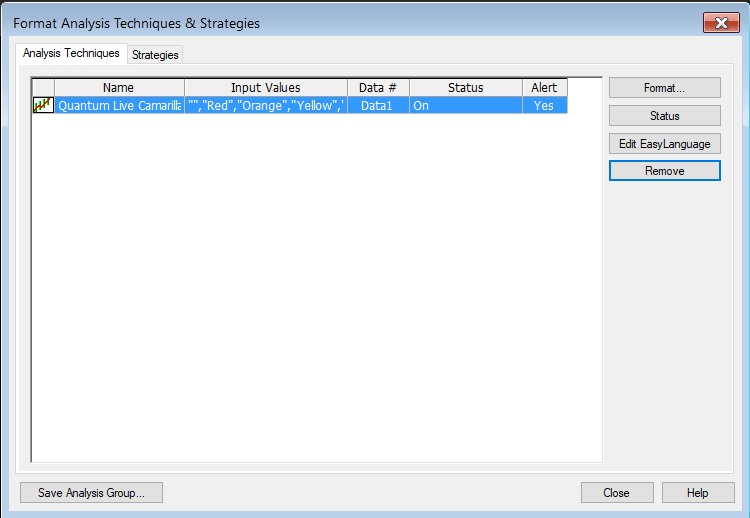
From the menu bar of your TradeStation platform, click Format > Analysis Techniques…
In the Analysis Techniques tab, select Quantum Live Camarilla Levels and click Remove then click Close.
Applying the indicator to RadarScreen
From the Apps menu of your TradeStation platform, please open a RadarScreen window.
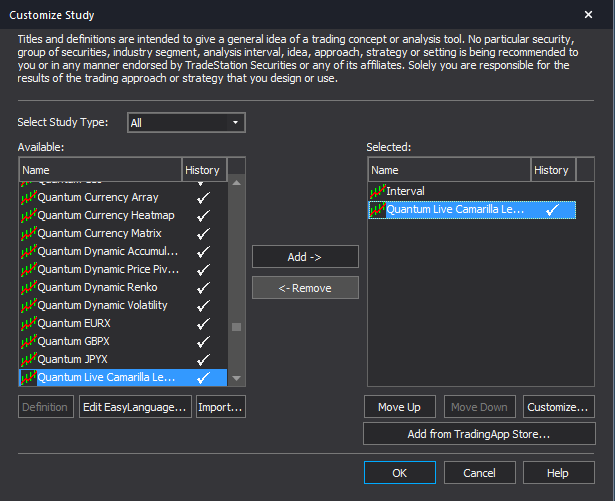
From the menu bar, click Insert > Indicator… > Indicator tab then scroll down at the indicators list at the left hand side and select the Quantum Live Camarilla Levels. Click the Add -> button to apply the indicator in the RadarScreen. You can change the order of the indicators by clicking the Move up and Move down buttons while the indicator is selected in the list at the right hand side.
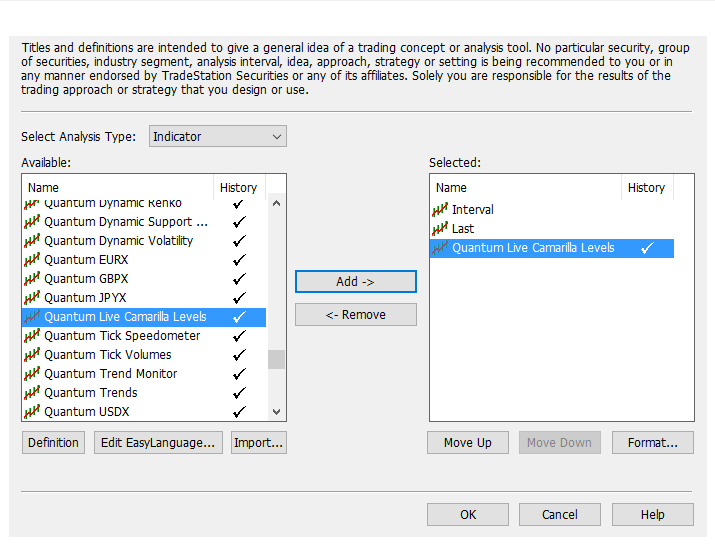
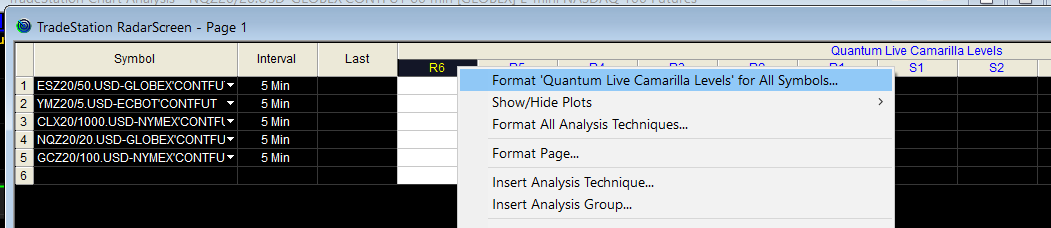
IMPORTANT: If this is your first time to run Quantum Trading indicators, the indicator will not work until you input your email address in its settings. To do this, please go back to your RadarScreen window and right-click the Quantum Live Camarilla Levels’s column header then select Format ‘Quantum Live Camarilla Levels’ for all Symbols…
In the Inputs tab, find the MyQuantumTradingEmail input and enter here the email address you used at the Quantum Trading Shop to activate the indicator. PLEASE MAKE SURE TO ENCLOSE THE EMAIL ADDRESS IN DOUBLE QUOTATION MARKS. (example: “myemailaddress@gmail.com”)
Click OK to save and go back to RadarScreen. Please note that you need to do this only once which means you do not need to input your email address again when running Quantum Trading indicators next time.
Compatible symbols in RadarScreen
The Quantum Live Camarilla Levels indicator works with any symbol.
RadarScreen columns
R6-R1
These columns show the 6 Resistance price levels of the Camarilla in the current row’s interval (timeframe)
S1-S6
These columns show the 6 Support price levels of the Camarilla in the current row’s interval (timeframe)
Analysis
Displays simple messages to guide you as the various levels are approached and tested.
Color changes in the RadarScreen
The cell’s background and text color may change on certain conditions.
Text color changes
- Columns R6-R1 and S1-S6 turn RED if the Camarilla price level (column) is BELOW the symbol’s
current price - Columns R6-R1 and S1-S6 turn BLUE if the Camarilla price level (column) is ABOVE the symbol’s
current price
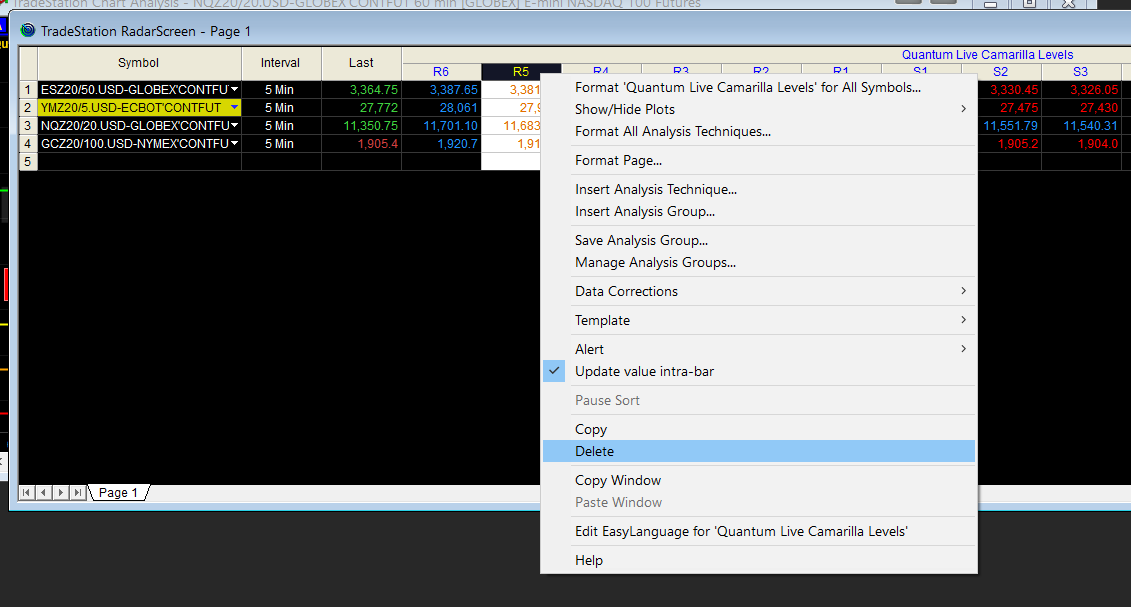
Removing the indicator from RadarScreen
From the RadarScreen window, right-click the Quantum Live Camarilla Levels’s column header then select Delete.