
Overview Of The Tick Speedometer Indicator
The Quantum Tick Speedometer indicator has been designed with one simple objective. To place the power of tick trading in your hands. It does this in several unique ways.
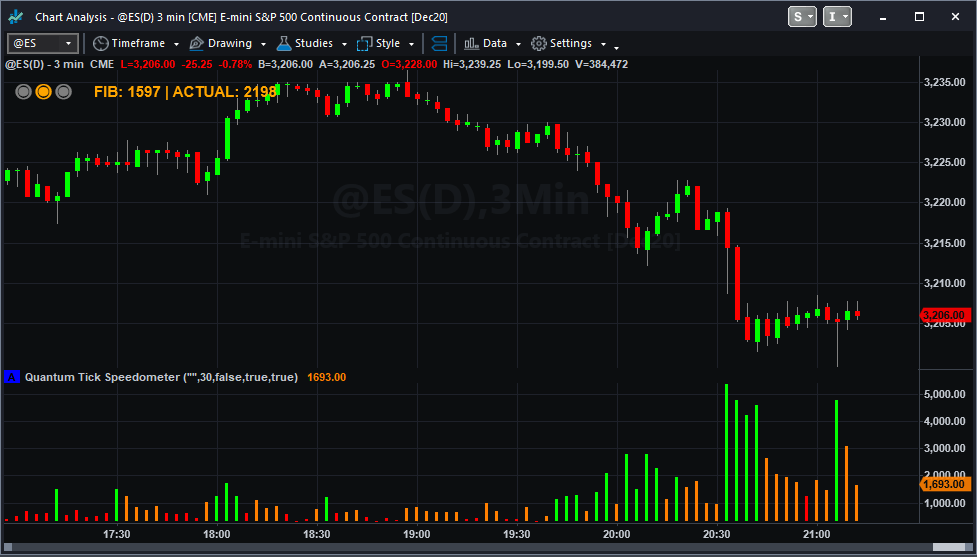
First, the indicator is dynamic. This is not a static indicator which only displays data based on history. It is dynamic, counting and displaying tick activity in realtime as the market moves tick by tick, and minute by minute.
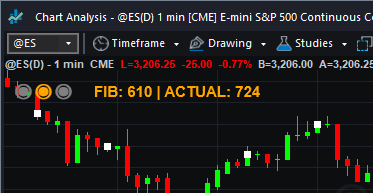
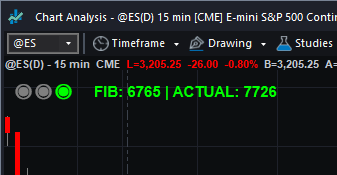
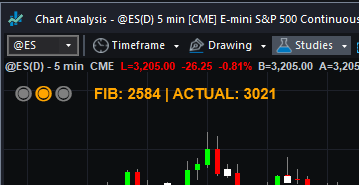
Second, the indicator acts as the bridge between time and tick. Apply the indicator to a time based chart and it will display the current tick speed for that instrument, at that precise moment in the session. It’s a time tick converter if you like. So for example if you are an index trader and prefer the 1 minute chart, apply the indicator and this will then display the equivalent tick speed for the index dynamically. This will change throughout the trading session allowing you to see the momentum changes as tick speeds increase or decrease accordingly
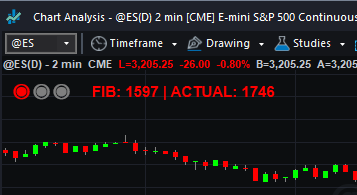
Third, the indicator displays both the actual and the closest Fib number. This gives you the option to trade using the actual tick speed, or the closest Fibonacci number to the actual. The Fibonacci number will change less often requiring fewer changes to the tick chart setting, whilst the true number will change more frequently. It’s your choice.
Fourth, the indicator includes a traffic light system which gives a visual signal of whether the tick speed for that timeframe is speeding up or slowing down. When the red traffic light is displayed it’s a strong signal of low volatility, and a warning signal of possible danger ahead as the price action moves into congestion.
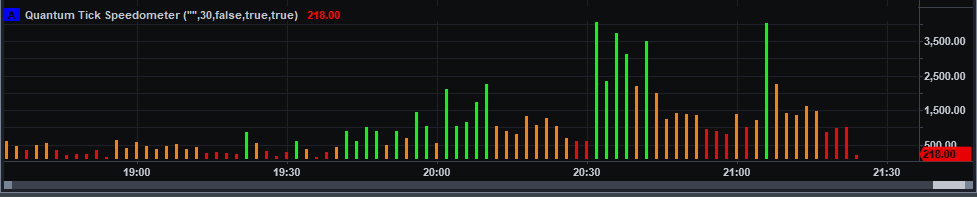
Fifth and last, the indicator displays the levels of tick activity graphically, showing those areas of high medium and low volatility.
The indicator works in all timeframes from seconds and minutes, and with all instruments and markets. So whether you are a scalping trader on the ES E-mini or other indices, or perhaps a swing trader of commodities, stocks, or bonds, the indicator will deliver all the tick information you need to start trading with the professionals.
The Quantum Tick Speedometer indicator finally puts the power of tick trading within your grasp. No more guesswork, no more asking other traders – soon they will be asking you! The Quantum Tick Speedometer indicator is easy to install and configure, then presents all the tick data for you simply and graphically. All you have to do is start trading and join the professionals today.
Using the indicator in TradeStation Securities
Setting the Tick Count data
The Tick Speedometer indicator requires Tick Count data (not Trade Volume) on any symbol to operate accurately. This must be configured in the Chart Analysis’s Data options before starting to use the indicator.
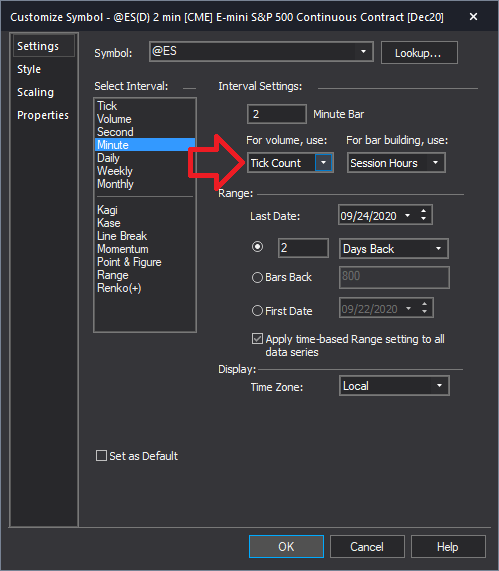
From the Chart Analysis window’s toolbar, please click Data > Edit Symbol… then select Settings section at the left hand side of the window. Find the drop down menu under the “For volume” label and select the value “Tick Count” from the options to activate the tick volume data which the indicator needs in its calculations. Click OK to confirm and with this, you are now ready to use the Quantum Tick Speedometer.
Applying the indicator to a Chart Analysis window
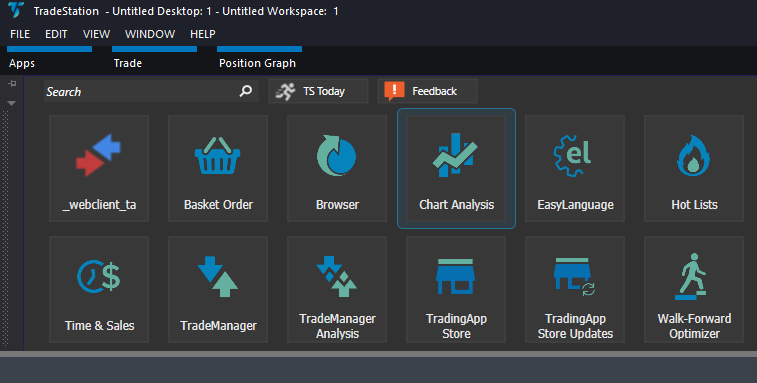
From the Apps menu of your TradeStation platform, please open a Chart Analysis window.
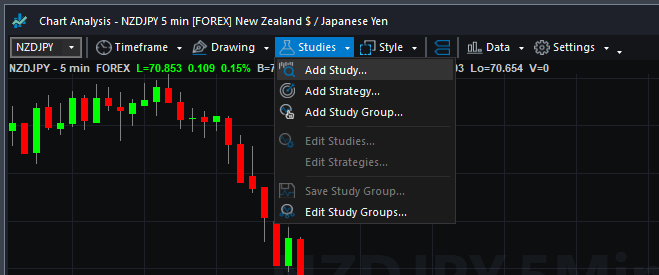
From the Chart Analysis window’s toolbar, please click Studies > Add Study…
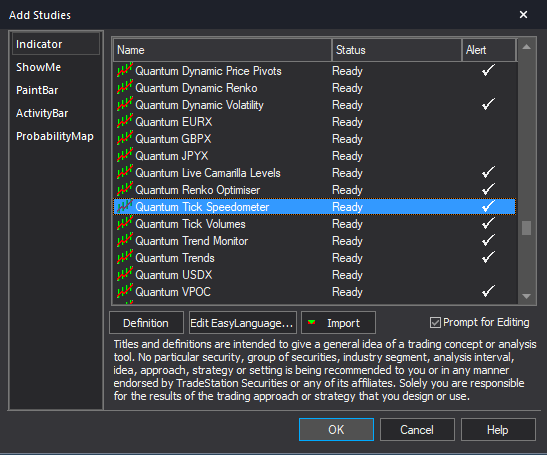
From the Add Study window, please choose Indicator at the left hand side of the interface then at the right, scroll down and select Quantum Tick Speedometer. Click OK to apply the indicator to the chart.
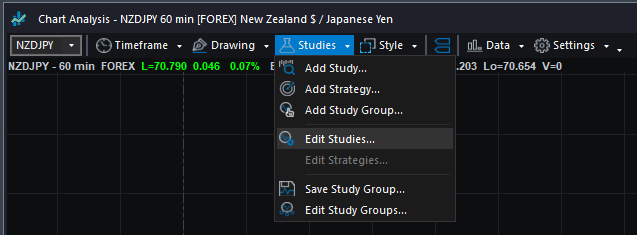
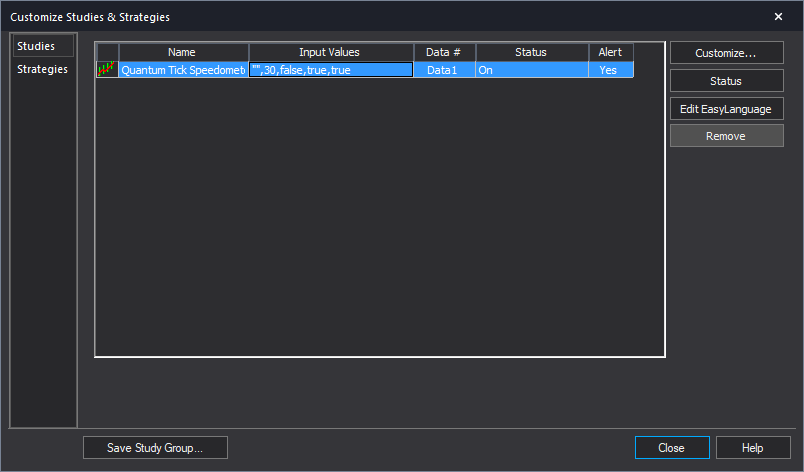
IMPORTANT: If this is your first time to run Quantum Trading indicators, the indicator will not work until you input your email address in its settings. To do this, please go back to your Chart Analysis window and click Studies > Edit Studies…
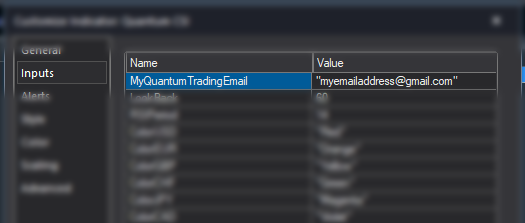
Select the indicator from the list then turn it On by clicking the Status button at the right hand side of the window. Click Customize… or double-click the Quantum Tick Speedometer to open the Customize Indicator window. In the Inputs section, find the MyQuantumTradingEmail input and enter here the email address you used at the Quantum Trading Shop to activate the indicator. PLEASE MAKE SURE TO ENCLOSE THE EMAIL ADDRESS IN DOUBLE QUOTATION MARKS. (example: “myemailaddress@gmail.com”)
Click OK (and Close) to save and go back to your chart. Please note that you need to do this only once which means you do not need to input your email address again when running Quantum Trading indicators next time.
Customizing the indicator in Chart Analysis
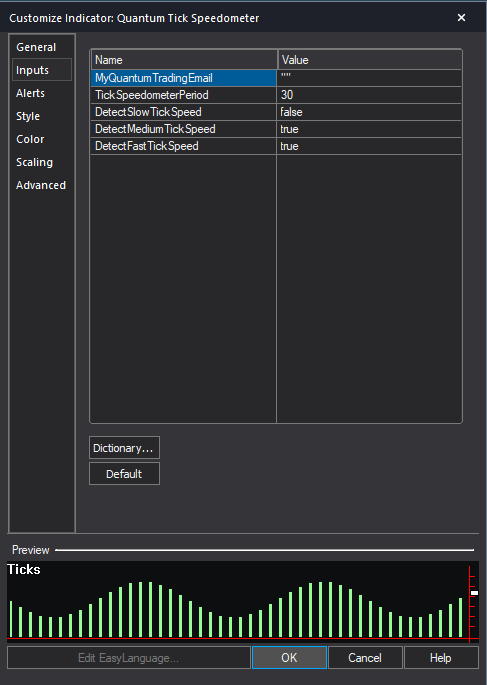
Inputs
- MyQuantumTradingEmail – When running the indicator for the first time in your TradeStation trading account, you need to enter the email address you used to purchase the indicator in the Quantum Trading Shop as part of its verification process. You need to do this only once as the indicators “remember” your email address by storing it in the local drive. Please make sure that you enter your email address correctly and exactly without any extra spaces before and after it. If you made an error, simply fill this input again to update it. This is a string input which requires you to enclose your email address in double quotation marks (“”).
- TickSpeedometerPeriod – This is the number of bars the indicator processes to calculate the relative speed or rate of incoming ticks in a given timeframe. The default is 30 and you can change this if you wish to cover more data from the bar history.
- DetectSlowTickSpeed – This input tells the indicator to send alert notifications when the speed signal changes to “Slow”. This is set to false by default.
- DetectMediumTickSpeed – This input tells the indicator to send alert notifications when the speed signal changes to “Medium”. This is set to true by default.
- DetectFastTickSpeed – This input tells the indicator to send alert notifications when the speed signal changes to “Fast”. This is also set to true by default.
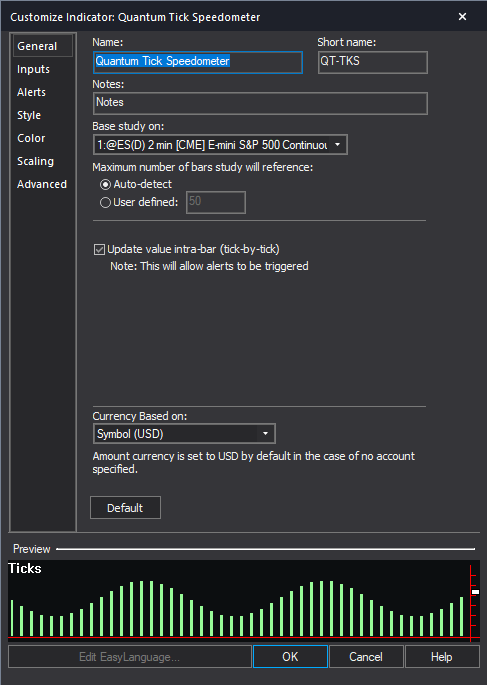
General
You can modify the name, short name, notes, maximum number of bars the indicator will reference, and more. We do not recommend changing any of the settings in this section but you can learn more about the different options in the General tab in TradeStation’s help guide at the link below.
http://help.tradestation.com/10_00/eng/tradestationhelp/study/customize_study_general.htm
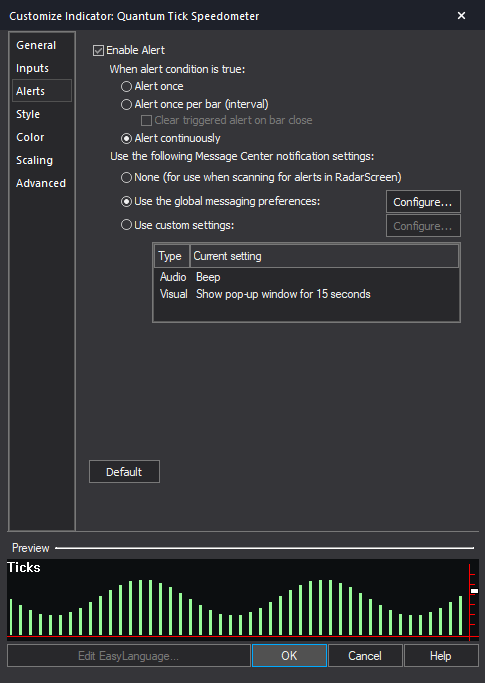
Alerts
The Quantum Tick Speedometer indicator triggers alerts when the speed signal changes. This can be for slow tick speed, medium tick speed, and fast tick speed. The user is not alerted for slow tick speeds by default but you can easily change this by turning the value of the DetectSlowTickSpeed input to true.
You can learn more about the different options in the Alerts tab in TradeStation’s help guide at the link below.
http://help.tradestation.com/10_00/eng/tradestationhelp/study/customize_study_alerts.htm
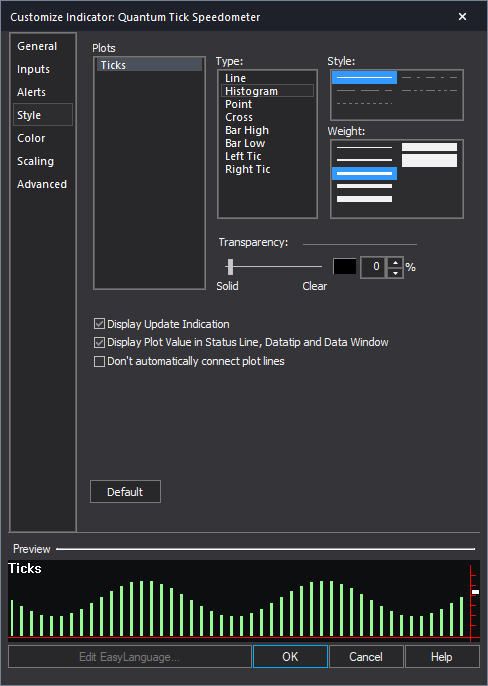
Style
The indicator uses 1 histogram plot to display the tick count for each bar. You can change the appearance of the plot such as its thickness but we suggest keeping the plot type to histogram.
You can learn more about the different options in the Style tab in TradeStation’s help guide at the link below.
http://help.tradestation.com/10_00/eng/tradestationhelp/study/customize_study_style.htm
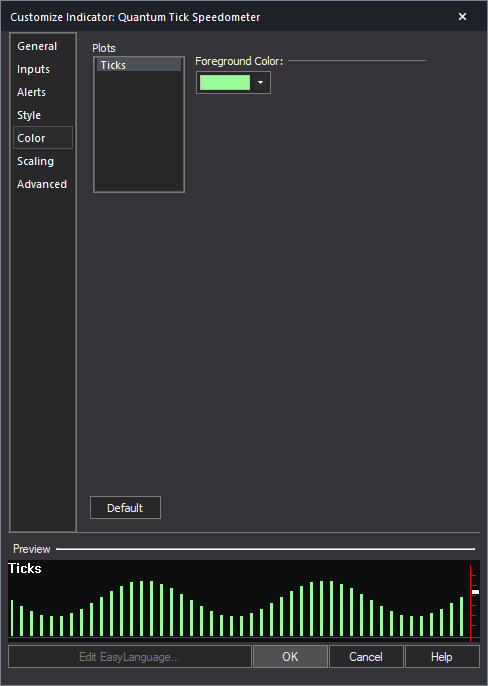
Color
The color of the plot changes dynamically inside the indicator each time the speed signal changes: red for slow, orange for medium and green for fast. Any change to this section does not affect the colors of the plot.
You can learn more about the different options in the Color tab in TradeStation’s help guide at the link below.
http://help.tradestation.com/10_00/eng/tradestationhelp/study/customize_study_color.htm
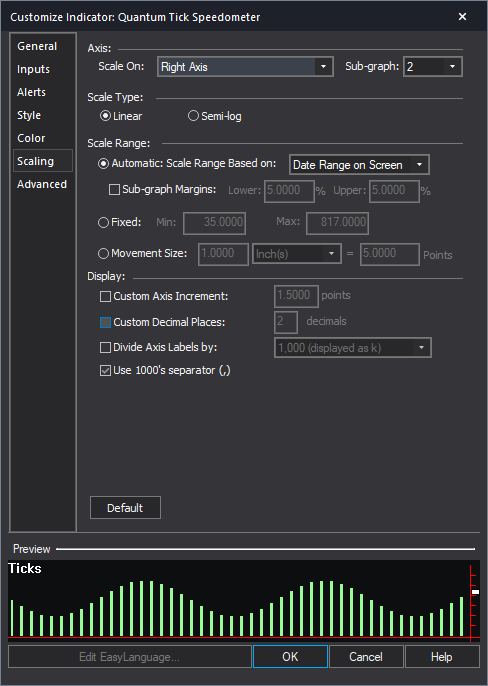
Scaling
The Scaling tab is used to modify the scaling settings for the y-axis of the indicator in the active Chart Analysis window. We do not recommend changing any of the settings in this section but you can learn more about the different options in the Scaling tab in TradeStation’s help guide at the link below.
http://help.tradestation.com/10_00/eng/tradestationhelp/study/customize_study_scaling.htm
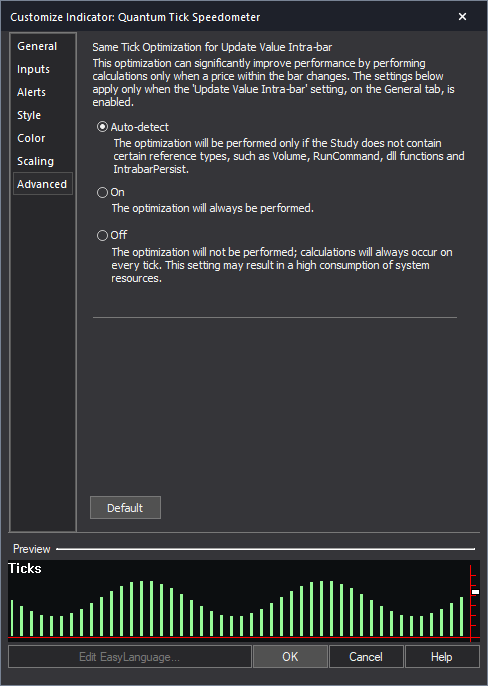
Advanced
The Advanced tab allows you to set advanced preferences for the indicator. We do not recommend changing any of the settings in this section but you can learn more about the different options in the Advanced tab in TradeStation’s help guide at the link below.
http://help.tradestation.com/10_00/eng/tradestationhelp/study/customize_study_advanced.htm
Removing the indicator from the Chart Analysis window
From the Chart Analysis window’s toolbar, please click Studies > Edit Studies…
In the Studies tab, select Quantum Tick Speedometer and click Remove then click Close.
RadarScreen
The Quantum Tick Speedometer is not built for the RadarScreen app.